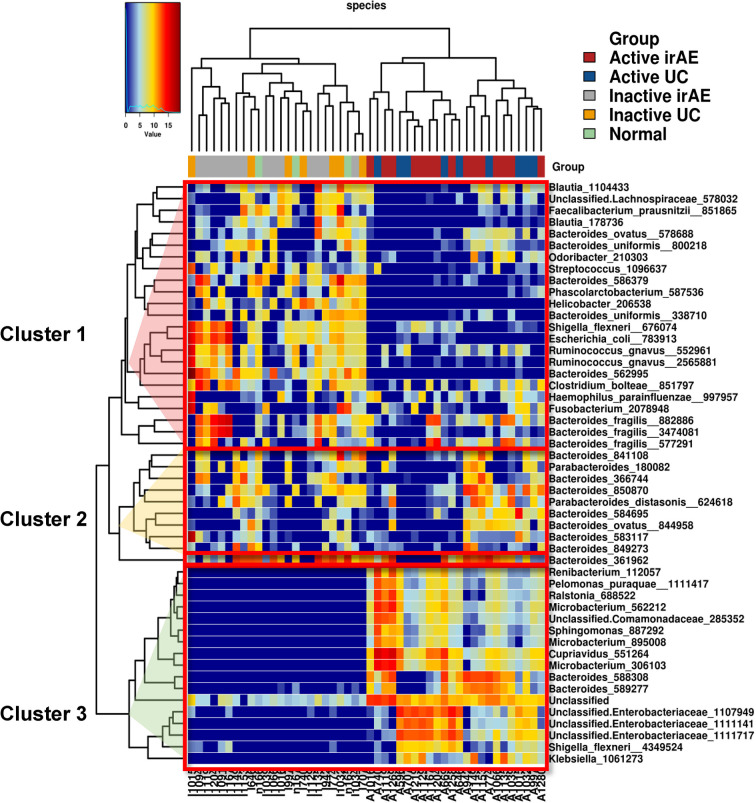
Figure 4.
Heatmap of unsupervised hierarchical clustering of tissue microbiota composition at species level based on the Bray-Curtis distance metric. The bacteria that are shown represent the 50 most abundant taxa across all fraction samples. Taxa abundance is shown according to color ranging from red (highly abundant) to blue (rare or absent) and the values of taxa correspond to the heatmap scale on top of the main heatmap.

