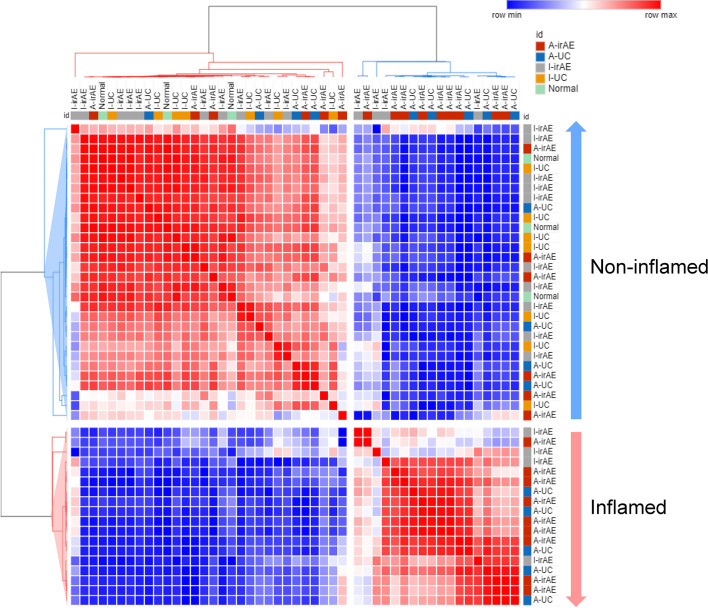
Figure 5.
Correlation heatmap of relative abundance of 50 most abundant inferred KEGG orthology pathways selected by Piphillin in I-irAE (n = 14), I-UC (n = 9), A-irAE (n = 15), A-UC (n = 9), and normal samples (n = 3) using Pearson’s correlation metric. Values were scaled to z-score and colors correspond to correlation, red = high correlation and blue = low correlation. Dendrograms represent average distance. Two main clusters were identified, and samples characterized by inflamed (A-irAE and A-UC) and non-inflamed (I-irAE, I-UC, and normal) status were correlated accordingly.

