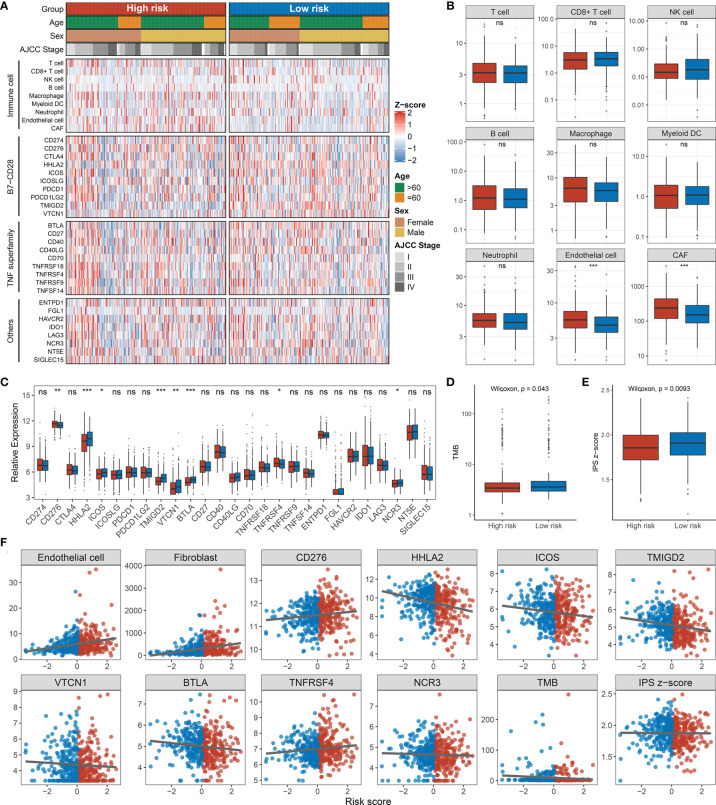
Figure 10.
Immune infiltration analysis. (A) Assessment of infiltration abundance of nine immune cells and 27 immune checkpoints in patients with high or low RDPS scores. (B) Abundance of immune cell infiltrates in the high- and low-risk groups. (C) Differential expression analysis of immune checkpoints. The difference of TMB (D) and IPS (E) in different risk groups. (F) Correlation analysis of immune cells or checkpoints with risk scores (ns, p > 0.05; *p < 0.05; **p < 0.01; ***p < 0.001). NS, none significance.

