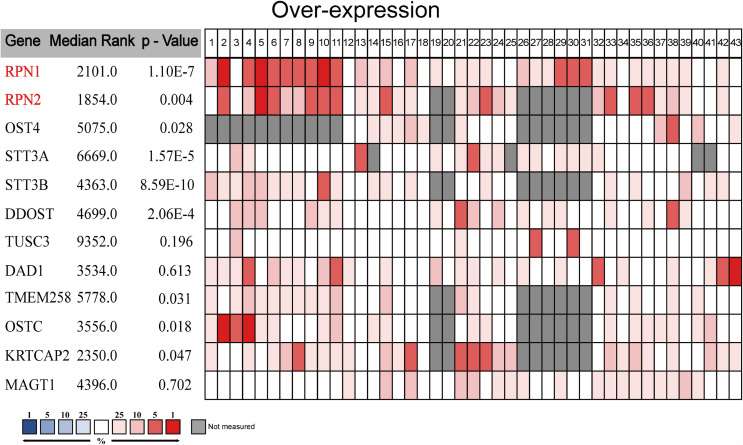
Figure 3.
The meta-analysis on the mRNA expression of OST subunits (Oncomine). The comparison of OST subunit mRNA expression in different datasets. Only the upregulated subunits were listed. The rank for a gene was the median rank for that gene across each of the analyses. The p-value for a gene was its p-value for the median-ranked analysis, and p<0.01 was considered statistically significant.

