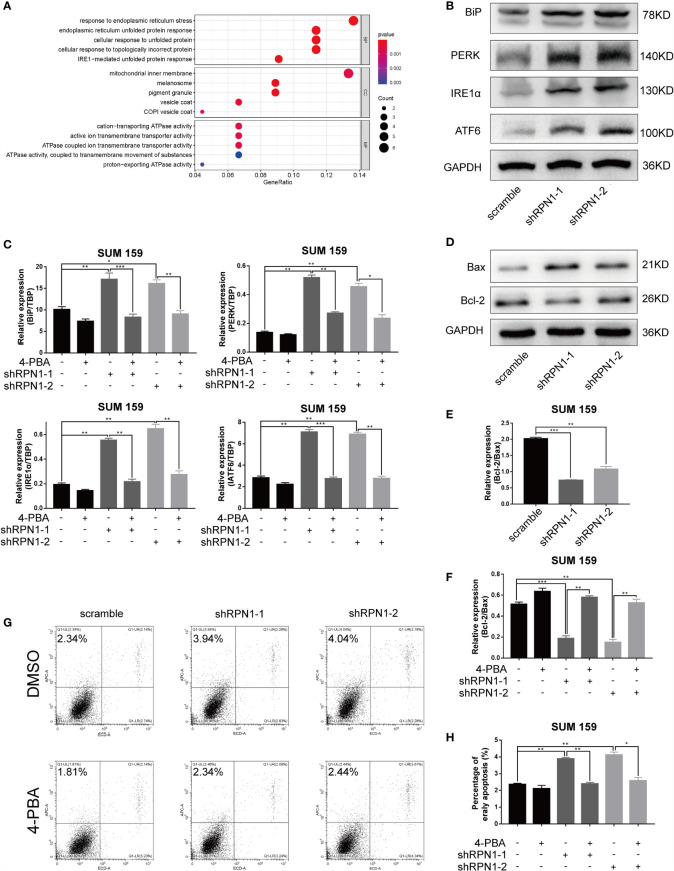
Figure 8.
ERS-dependent apoptosis was triggered by the knockdown of RPN1. (A) Bubble plot of the GO function enrichment analysis of the genes positively correlated with RPN1 RNA expression level in BLBC. Y-axis represents the name of the function, and X-axis represents the ratio of the number of the genes assigned to a term to the total number of the genes. The Bubble size represents the number of the genes annotated to the function. The color of the bubble represents the enriched P-value, while the red indicates a greater significance level. (B) The expression of ERS-related proteins was detected by western blot in SUM159 cells. (C) Scramble and shRPN1-infuected SUM159 cells were treated with 4-PBA (2 uM) or same volume of DMSO for 48 h, and the ERS markers were determined by qRT-PCR. (D, E) The protein expression of Bax and Bcl-2 in SUM159 detected by western blot and the ratio of the protein expression of Bcl-2 and Bax were also shown. (F) The ratio of the mRNA expression level of Bcl-2 and Bax was determined by qRT-PCR in 4-PBA- or DMSO-treated SUM159 cells. (G, H) Apoptosis analyzed by flow cytometry in 4-PBA- or DMSO-treated SUM159 cells. *P < 0.05, **P < 0.01 and ***P < 0.001. BP, Biological process; CC, cellular component; MF, molecular function; 4-PBA, Sodium phenylbutyrate.

