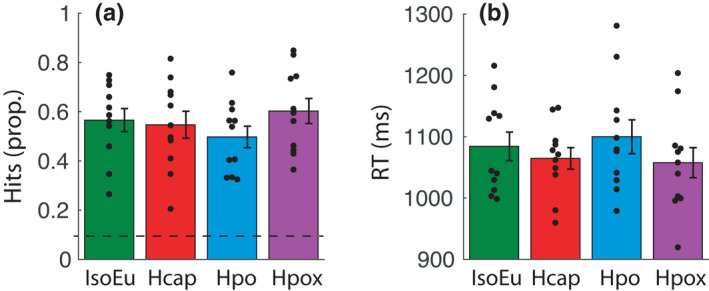
FIGURE 2.

Behavior (a) proportion of “hits” (correctly detected targets). A dashed horizontal line represents chance performance. (b) RTs to correctly detect targets. There was no significant effect of gas condition on hits or RT. Error bars represent ± SEM
