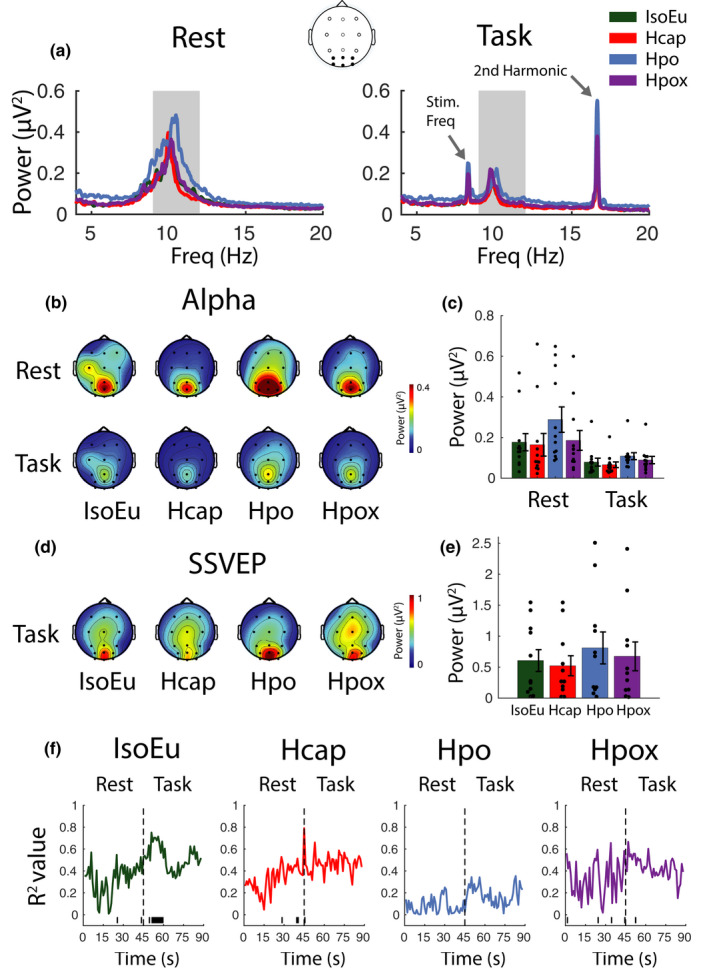
FIGURE 6.

Spectral electroencephalographic and neurovascular coupling analyses. (a) Spectral power during rest and task phases. Data represent the mean of PO/O electrodes. The shaded area represents alpha frequencies used for subsequent calculations. (b) Distribution of alpha across the scalp during rest and task phases. (c) Alpha power (mean of PO/O electrodes). (d) Distribution of steady‐state visual evoked potential (SSVEP) activity [second harmonic; 16.67 Hz] across the scalp during the task phase. (e) SSVEP amplitude (mean of PO/O electrodes). (f) Alpha power regressed against posterior cerebral artery velocity and middle cerebral artery velocity at 1 s intervals across a full rest/task epoch (horizontal line at the base of plot indicates time points, where p null < 0.05). Error bars represent ±SEM
