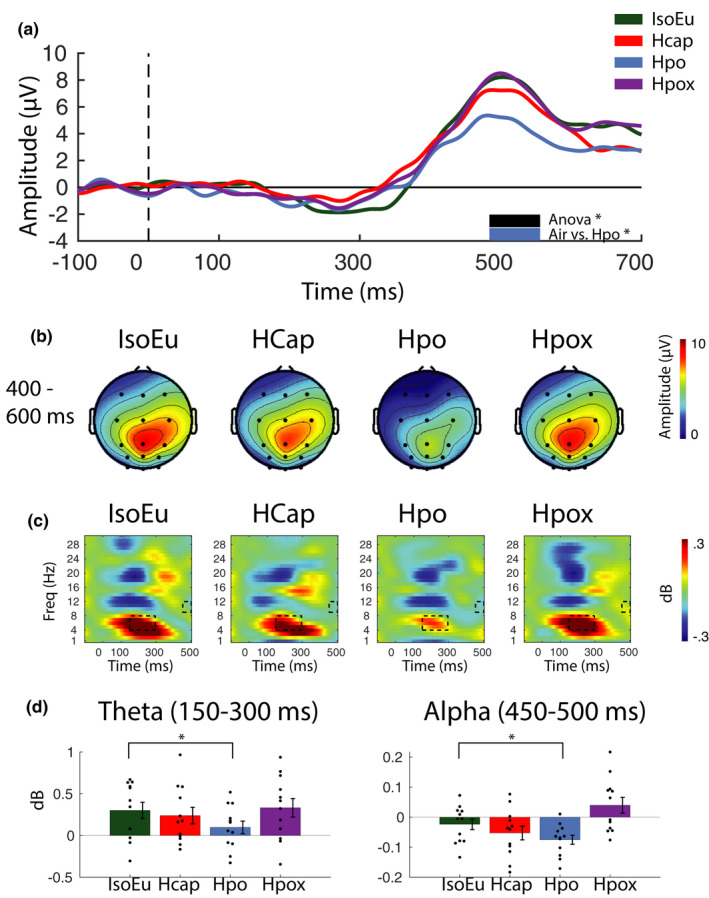
FIGURE 7.

Event‐related electroencephalographic data analyses. (a) Event‐related potentials (ERPs) were computed using mean activation over central, parietal, and parieto‐occipital electrodes for correctly detected target trials. Plots reveal a robust P3 ERP component emerging ~300 ms after the onset of the target period (0 ms). Thick horizontal black and blue bars represent significant ANOVA and pairwise comparisons (p null < 0.05). (b) Distribution of P3 ERP activity across the scalp between 400 and 600 ms during correctly detected target trials. (c) Event‐related spectral perturbations (ERSPs) plots show the time course of spectral activation during standard trials in the task phase. Each plot represents activation averaged across parietal and parieto‐occipital and occipital electrodes. Black rectangles denote time–frequency regions that are significantly different according to the ANOVA tests. (d) Bars represent mean activation for regions highlighted in the ERSP plots. Pairwise comparisons indicate that differences in the time–frequency plots are driven by reduced theta and alpha in Hpo relative to IsoEu (*p null < 0.05). Error bars represent ±SEM
