
FIGURE 8.
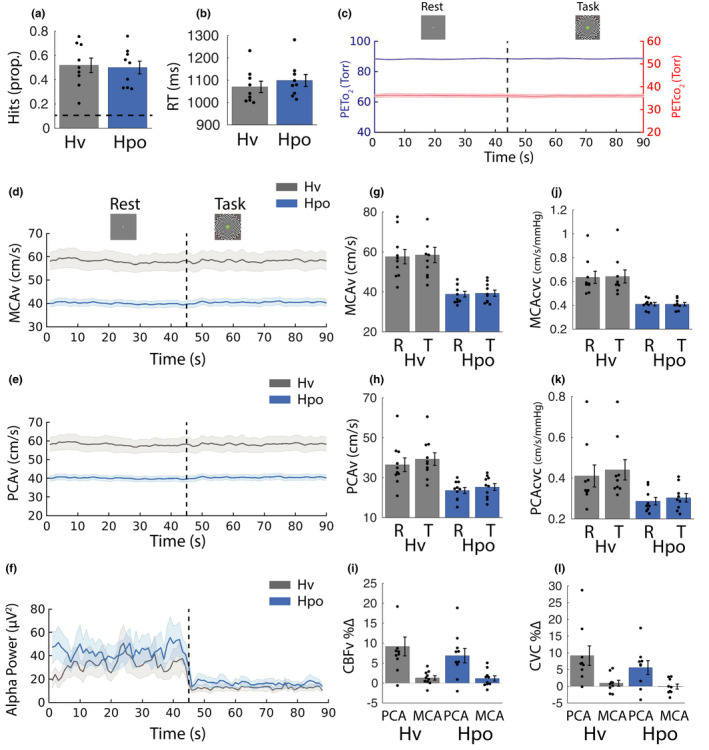
Control analyses. Behavioral performance and physiologic responses were recorded during the isocapnic hyperventilation control condition (Hv) and compared with the hypocapnia condition (Hpo). (a) Proportion of “hits” (correctly detected targets). A dashed horizontal line represents chance performance. (b) RTs to correctly detect targets. (c) Mean Peto 2 and Petco 2 traces are plotted, collapsed across all eight 90 s rest (0–45 s)/task (45–90 s) cycles for the Hv condition. (d–f) Middle cerebral artery velocity (MCAv), posterior cerebral artery velocity (PCAv), and alpha power (mean of PO/O electrodes), respectively. (g) MCAv and (h) PCAv averaged across the final 15 s of rest and task phases. (i) Percent change in CBFv in PCA and MCA from rest to task phase (normalized to the final 15 s of rest phase). (j) MCA cerebrovascular conductance (MCAcvc) and (k) PCA cerebrovascular conductance (PCAcvc) averaged across the final 15 s of rest and task phases. (l) Percent change in cerebral blood flow cerebrovascular conductance (CBFcvc) in PCA and MCA from rest to task phase (normalized to the final 15 s of rest phase). Error bars represent ±SEM