FIGURE 9.

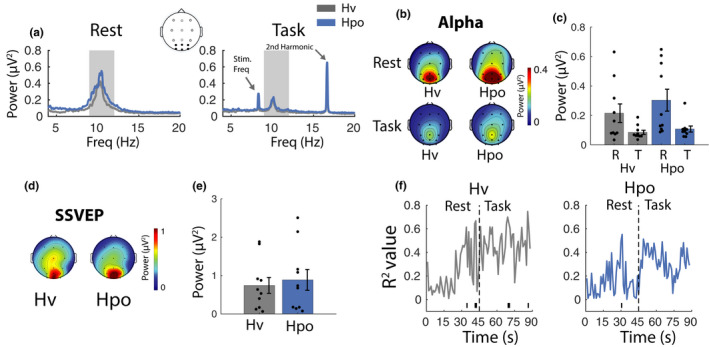
Spectral electroencephalographic and neurovascular coupling control analyses (a) Mean spectral power during rest and task phases. Lines on plot represent the mean of PO/O electrodes. The shaded area represents the alpha frequency band (9–12 Hz). (b) Topographic plots reflect the distribution of alpha activity (9–12 Hz) across the scalp during rest and task phases. (c) Bars represent mean alpha amplitude in each condition (mean of PO/O electrodes). (d) Distribution of steady‐state visual evoked potential (SSVEP) activity (second harmonic; 16.67 Hz) across the scalp during the task phase. (e) SSVEP amplitude (mean of PO/O electrodes). (f) Plots represent alpha power regressed against posterior cerebral artery and middle cerebral artery at 1 s intervals across a full rest/task epoch (horizontal line at the base of plot indicates significant results at p null < 0.05). Error bars represent ±SEM
