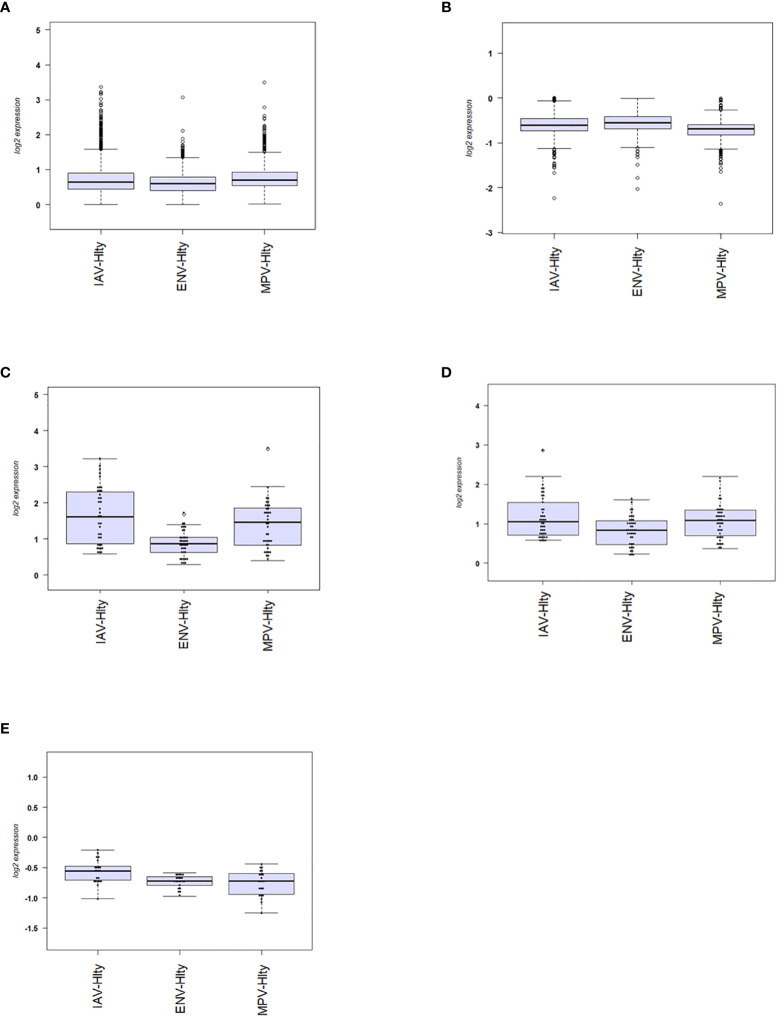
Figure 3.
Magnitude of responses of DEG. (A) The mean fold change difference compared to healthy controls was calculated for up-regulated DEGs induced by each virus. Differences between IAV and ENV and between MPV and ENV were statistically significant. Y-axis: difference in log2 fold expression compared to healthy controls. (B) The mean fold change difference to healthy controls was calculated for each pathogen group and all down-regulated DEGs. Differences between MPV groups and ENV and between MPV and IAV groups were statistically significant. Y-axis: difference in log2 fold expression to healthy controls. (C) The mean fold change difference to healthy controls was calculated for each pathogen group and DEG associated with pathway ‘Response to type I interferon’. The differences between IAV and MPV groups and between MPV and ENV groups were statistically significant. Y-axis: difference in log2 fold expression compared to healthy controls. (D) The mean fold change difference to healthy controls was calculated for each pathogen group and DEG associated with pathway ‘Cytokine secretion’. The differences between IAV and ENV groups between ENV and MPV groups were statistically significant. Y-axis: difference in log2 fold expression to healthy controls. (E) The mean fold change difference to healthy controls was calculated for each pathogen group and DEG associated with pathway ‘Regulation of T cell activation’. The differences between IAV groups and MPV and between IAV and ENV groups were statistically significant. Y-axis: difference in log2 fold expression to healthy controls. IAV-Hlty: difference in normalized gene expression levels per gene between IAV infected and healthy controls; ENV-Hlty: difference in normalized gene expression levels per gene between ENV infected and healthy controls; MPV-Hlty: difference in normalized gene expression levels per gene between MPV infected and healthy controls.

