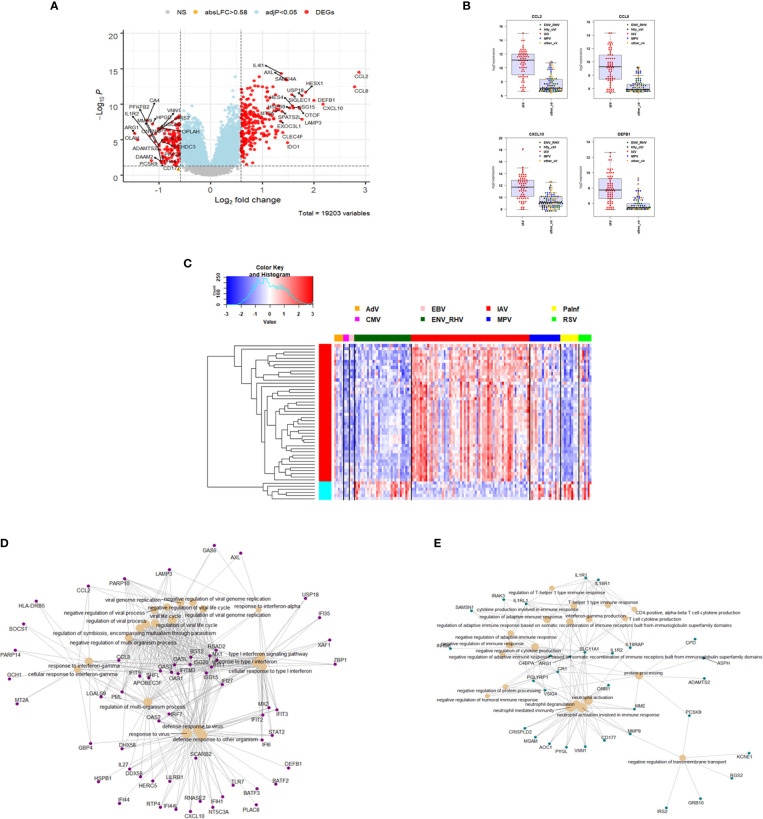
Figure 4.
Responses in IAV versus other respiratory infections. (A) Volcano plot of results of the contrast from the linear regression analysis of influenza virus infected versus all other respiratory virus infections. y-axis: -log10 BH multiple testing adjusted p-values, x-axis: log2 fold change. DEGs (absolute log-fold change > 1.5, corresponding to a log2-fold change > 0.58; multiple testing adjusted p-value < 0.05) are colored red and the top 20 up- and down-regulated (by log-fold change) DEGs are labeled. Blue: genes with adjusted p-value < 0.05. (B) Normalized gene expression levels of the top four most strongly up-regulated (by absolute fold-change) influenza virus versus all other respiratory virus specific DEGs. CCL2, C-C Motif Chemokine Ligand 2; CCL8, C-C Motif Chemokine Ligand 8; CXCL10, C-X-C Motif Chemokine Ligand 10; DEFB1, Defensin Beta 1; IAV, influenza; ENV_RHV, enterovirus/rhinovirus; MPV, human metapneumovirus; other_vir, all other respiratory viruses; hlty_contr, healthy controls. (C) Heatmap of expression levels of the top 50 most strongly regulated (by absolute fold-change) DEGs from the contrast of IAV infected patients versus all other respiratory infections are presented. Values were scaled by row. red: up-regulated DEGs, blue: down-regulated DEGS. IAV, influenza virus; ENV_RHV, enterovirus/rhinovirus; MPV, metapneumovirus; PaInf, parainfluenza virus; RSV, respiratory syncytial virus; AdV, adenovirus; CMV, cytomegalovirus; EBV , Epstein-Barr virus. (D) Functional analysis using GO term enrichment for the DEGs from the contrast of IAV infected versus all other respiratory virus infections. Network of top 20 up-regulated pathways and associated genes. Red: up-regulated. (E) Functional analysis using GO term enrichment for the DEGs from the contrast of IAV infected versus all other respiratory virus infections. Network of top 20 down-regulated pathways and associated genes. Green: down-regulated. NS, not significant.

