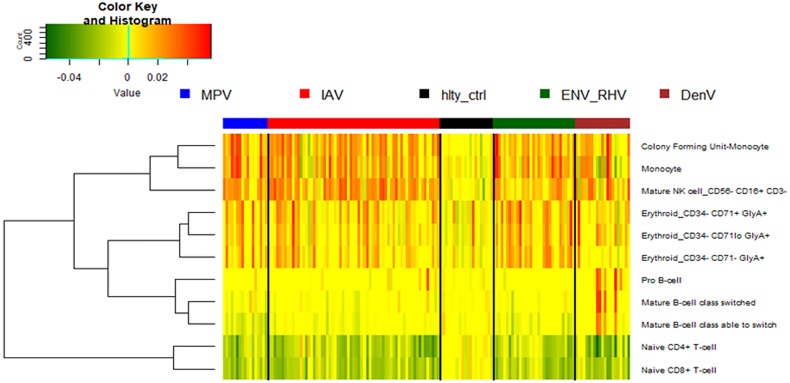
Figure 9.
Digital cell quantification. Using digital cell quantification, immune cells were quantified based on gene expression levels. The relative abundance of immune cell populations is presented as a heatmap. Shown are only cell populations that exhibited differences across any infected/healthy group. IAV, influenza virus; ENV_RHV, enterovirus/rhinovirus; MPV, metapneumovirus; DenV, dengue virus.

