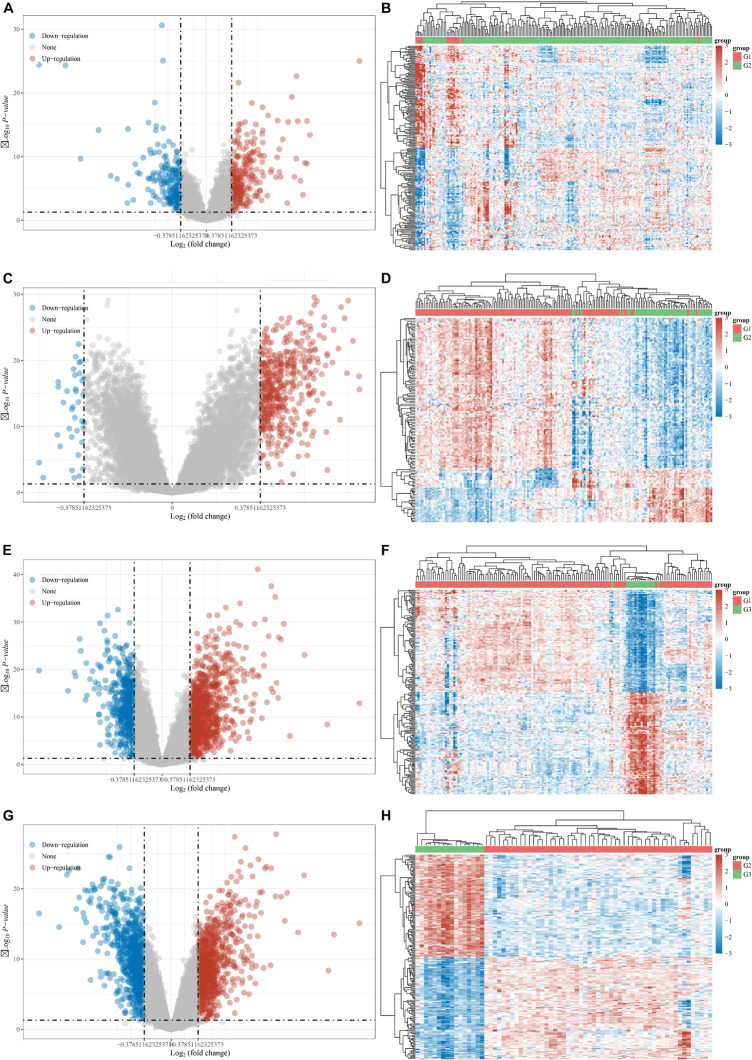
FIGURE 5.
Identification of DEGs between different clusters in MI. (A,B) Volcano plot and heatmap showed DEGs in MI compared with non-failing controls. (C,D) Volcano plot and heatmap showed DEGs in cluster 1 MI compared with cluster 2 MI samples. (E,F) Volcano plot and heatmap showed DEGs in cluster 1 MI compared with cluster 3 MI samples. (G,H) Volcano plot and heatmap showed DEGs in cluster 2 MI compared with cluster 3 MI samples.

