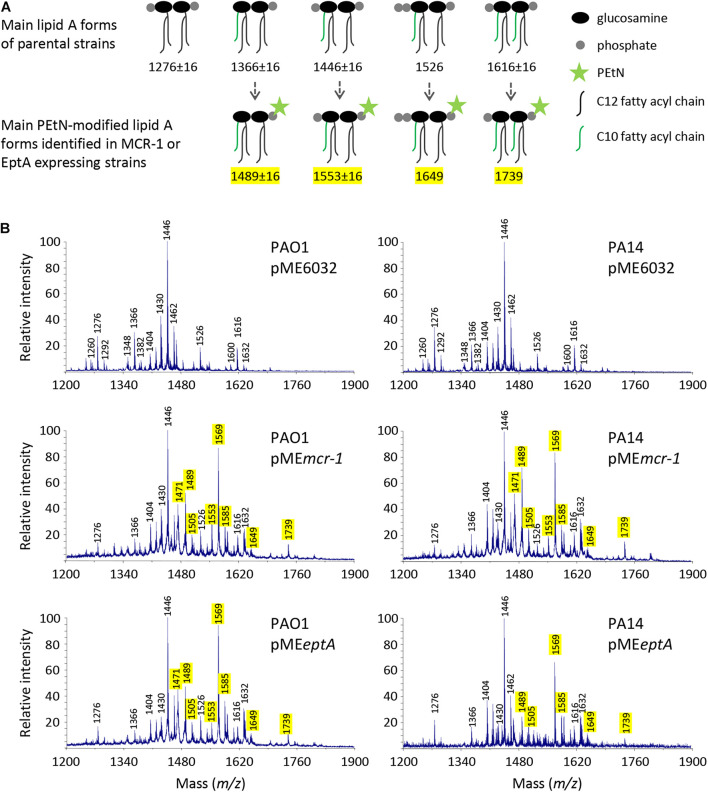
FIGURE 1.
Effect of MCR-1 or EptA expression on lipid A in P. aeruginosa PAO1 and PA14. (A) Cartoons showing the relevant lipid A forms identified by mass spectrometry. (B) MALDI-TOF spectra of lipid A extracted from cells cultured in the presence of 0.5 mM IPTG. Spectra were obtained in the ion negative mode, so m/z values correspond to (molecular mass – 1)/1. m/z = 1276, diphosphorylated tetra-acylated lipid A; m/z = 1366, monophosphorylated penta-acylated lipid A; m/z = 1446, diphosphorylated penta-acylated lipid A; m/z = 1526, triphosphorylated penta-acylated lipid A; and m/z = 1616, diphosphorylated hexa-acylated lipid A. m/z + 123 indicates the addition of a PEtN group, while m/z ± 16 indicates lipid A forms that vary for the presence/absence of a hydroxyl group in the secondary C12 acyl chains (Nowicki et al., 2015; Liu et al., 2017; Lo Sciuto et al., 2019). The peak at m/z = 1471 likely corresponds to the phosphoethanolaminated form of a still non-identified lipid A species at m/z = 1348 (Ghirga et al., 2020; Lo Sciuto et al., 2020). The m/z values of peaks corresponding to the phosphoethanolaminated lipid A forms here identified are highlighted in yellow.

