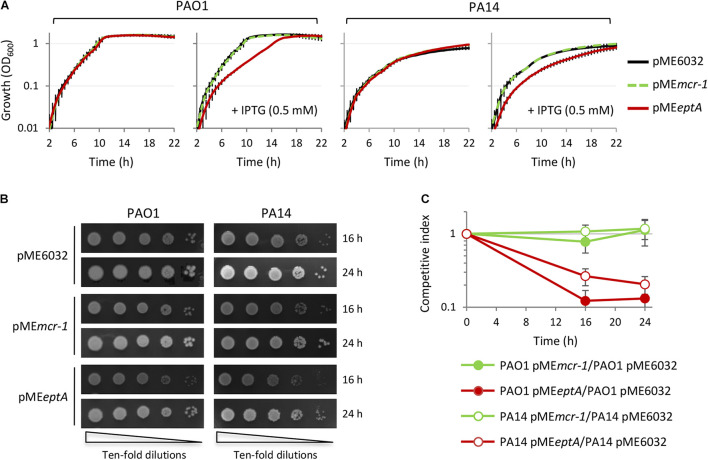
FIGURE 3.
Effect of MCR-1 or EptA overexpression on P. aeruginosa growth. (A) Growth curves of PAO1 or PA14 containing the empty vector pME6032 (black lines), pMEmcr-1 (green lines), or pMEeptA (red lines), cultured in the absence or in the presence of 0.5 mM IPTG. (B) Colony growth of the same strains described in (A) on agar plates containing 0.5 mM IPTG. (C) In vitro competition between PAO1 or PA14 cells with the empty vector and cells overexpressing MCR-1 or EptA in the presence of 0.5 mM IPTG. Data represent the mean (±SD) or are representative of at least three independent experiments.

