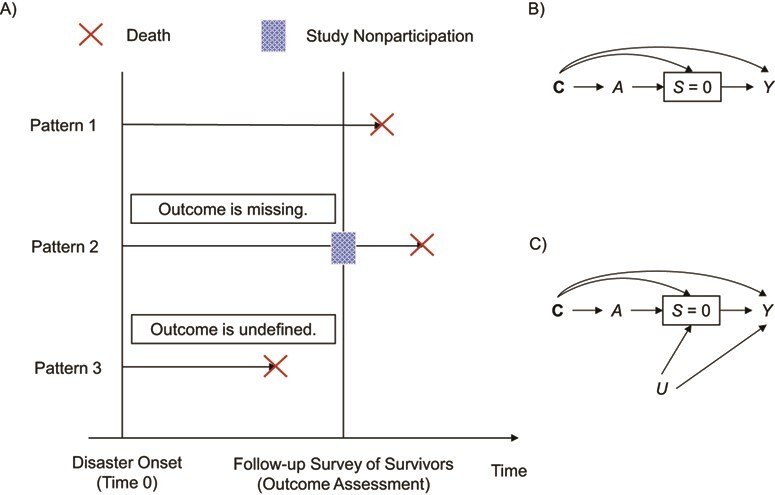
Figure 2.

Illustration of selection bias due to selective attrition. A) Attrition by death and study nonparticipation in studies of the association between disasters and health outcomes, assessed in a follow-up survey of survivors. B) Directed acyclic graph where an association between an exposure A and an outcome Y is biased due to confounding by measured covariates C and selection bias of conditioning on no censoring, S = 0. C) Directed acyclic graph where an association between an exposure A and an outcome Y is biased due to confounding by measured covariates C and selection bias induced by C and U, both of which cause no censoring S = 0 and an outcome Y.
