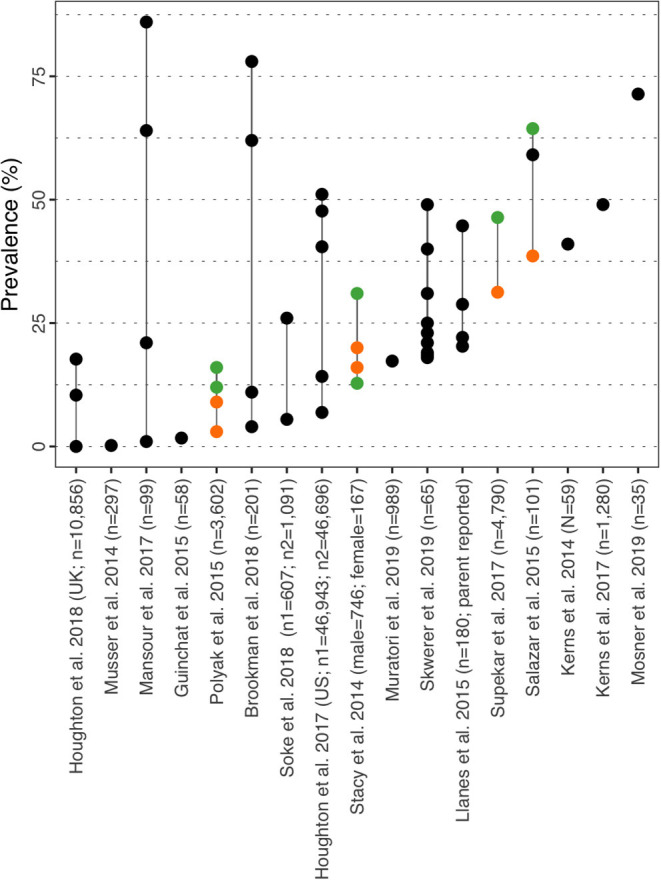
Figure 3.

ADHD prevalence estimates. Each point reports a prevalence estimate for the related comorbidity. Studies with more than one data point indicate the estimate of the prevalence among different subgroup of the population. See Supplementary Table 4 for the description of the population used in each study. Sample sizes are shown in brackets above each study label. Orange mark: Female population only; Green mark: Male population only; Black mark: No sex distinction.
