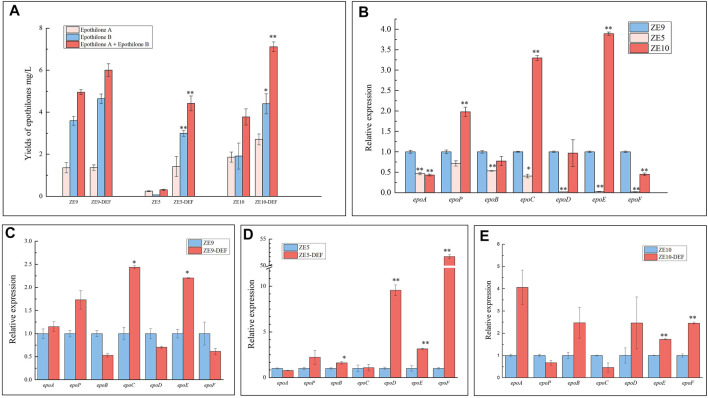
FIGURE 5.
CRISPRa of internal promoters in different epothilone-producing M. xanthus strains ZE9, ZE5, and ZE10. (A) Yield of epothilones in wild strains and the activation mutants. (B) RT-qPCR analysis of expression levels of the seven operon genes in ZE9, ZE5, and ZE10 after 48 h of incubation. The expressions of the seven operon genes in M. xanthus ZE9 were each set as 1, and the expressions of the genes in other strains are shown as the relative expression. (C,D) RT-qPCR analysis of expression levels of the seven operon genes in the activation mutants after 48 h of incubation. The expressions of the seven operon genes in wild strains were each set as 1, and the expressions of the genes in mutant strains are shown as the relative expression. The error bars represent the standard deviation of three independent experiments. For statistical analysis between the ancestral strain and mutant strains, the signals of ** and * mean p < 0.01 and p < 0.05, respectively.

