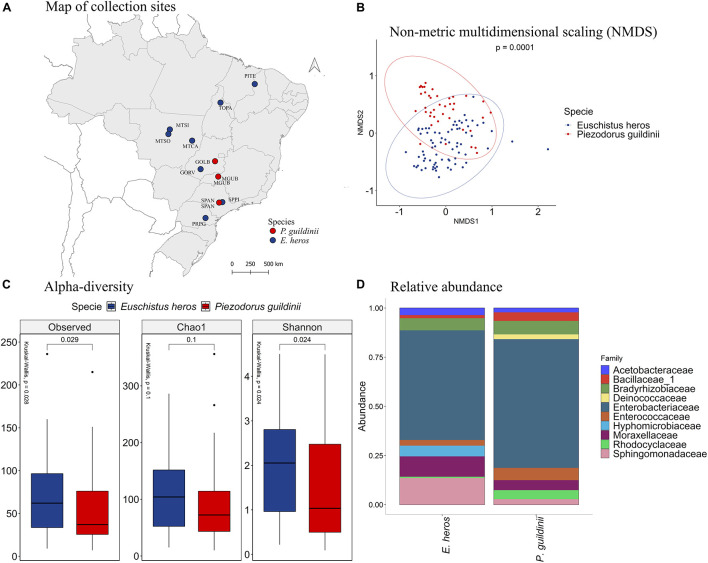
FIGURE 6.
(A) Mapping of collection sites of E. heros and P. guildinii, classified by species in Brazil. (B) NMDS of Bray-Curtis similarity matrix among 115 samples from the intestinal microbiome of E. heros and P. guildinii collected in Brazil. The ellipses are showing clustering between species. Multivariate analysis of variance (PERMANOVA) is indicated in the upper right. (C) Alpha diversity levels based on Observed OTU, Chao1 index and Shannon index for the different species. The non-parametric test (Kruskal–Wallis) is indicated in the upper left of each graph. Pairwise comparison (Wilcoxon) is indicated between Ecoregions. (D) Analysis of the ten most abundant bacteria families in the intestinal microbiome of E. heros and P. guildinii collected in Brazil, classified by species.

