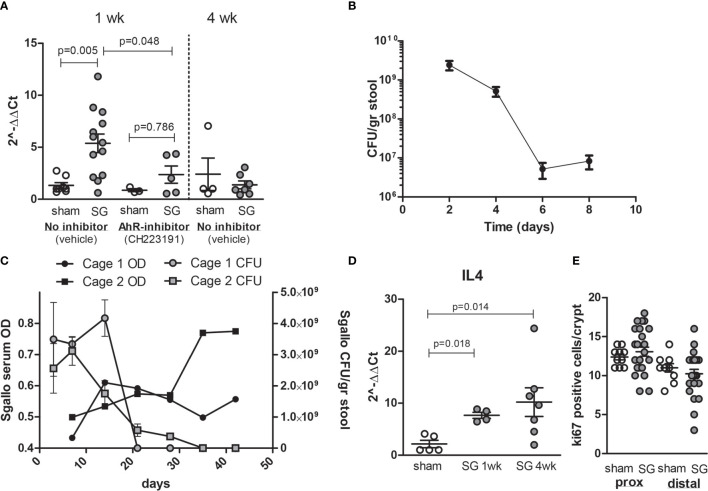
Figure 6.
Colonization of C57bl6 mice leads to CYP1A1 induction in cecum and effective clearance of S. gallolyticus. (A) Compared to sham mice (n = 8), S. galloltyicus UCN34 colonized mice show significantly increased levels of CYP1A1 at 1 week postcolonization (n = 13, Mann–Whitney U-test p = 0.005) that is not observed in mice treated with daily gavage of the AhR-inhibitor CH223191 (n = 5). At 4 weeks postcolonization, CYP1A1 induction is back to normal levels (n = 7). (B) Stool colonization of UCN34 monitored at 2 (n = 4), 4 (n = 8), 6 (n = 9), and 8 days (n = 14) postcolonization. Two out of five AhR-treated animals lost colonization by day 8, whereas 3 out of 13 vehicle-treated-mice lost colonization. The colonization levels at days 6–8 were not significantly different for vehicle or AhR-treated animals (Mann–Whitney U-test, p = 0.12, Supplementary Figure S6). (C) Colonization of S. galloltyicus UCN34 over time up to 42 days (6 weeks) with weekly serum collections (without vehicle or AhR-inhibitor) (n = 8). CFU of S. galloltyicus in gray circles (cage 1; n = 4) and squares (cage 2;n = 4) decreased after 3 weeks significantly, while antibody production starts to increase at 2–3 weeks postcolonization (black circles and squares). Cages were visualized separately because of differences in colonization and antibody responses between the two cages. The treatment, inoculation, and handling of the animals in these two cages was similar. (D) IL4 mRNA production is increased at 1 and 4 weeks post-UCN34 colonization compared to sham mice (Mann–Whitney U-test p = 0.018 and 0.014, respectively). (E) ki67 stained slides were scored for total number of positive ki67 cells per crypt; for each mice, five crypts were counted and plotted. No difference in ki67-positive cells was seen in proximal and distal colon at 1 week postcolonization compared to sham.

