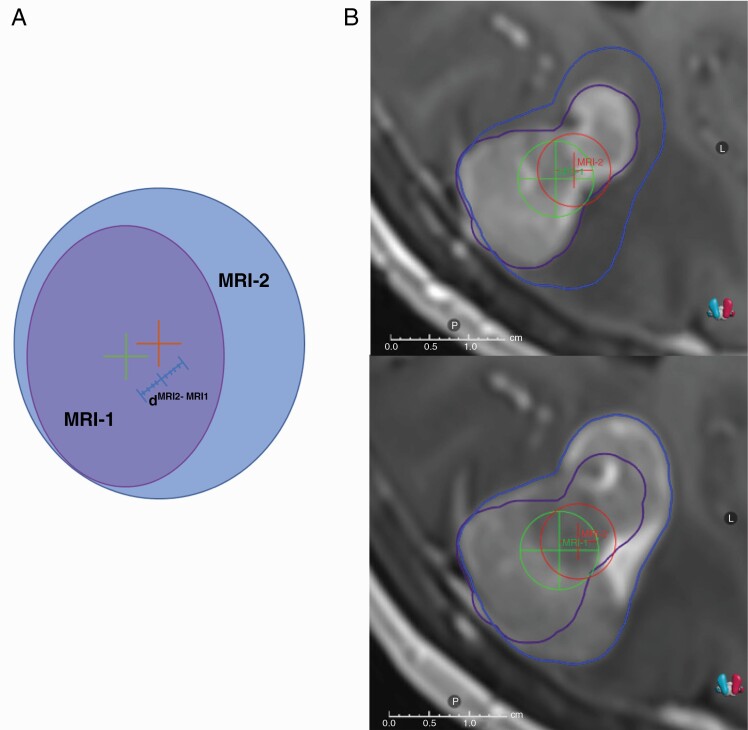
Figure 3.
Schematic 2D view of the distances between the centroids of the target volumes visualized on MRI-1 and MRI-2 (A). Tumor centroid of the GTV on MRI-1 (dMRI-1) is shown with a green plus sign and the tumor centroid of the GTV on MRI-2 is shown with orange plus sign. The maximum distance between the tumor centroids (dMRI-1 to dMRI-2 distance) is shown with a blue line (A). Actual view of tumor displacement on an example MRI-1 and MRI-2. The patient had a tumor centroid displacement of 2.3 mm in R-L direction, 1 mm in S-I direction, and 1.1 mm in P-A direction. Therefore, the overall dMRI-1 to dMRI-2 distance was 2.74 mm (B). Abbreviations: GTV, gross tumor volume; MRI, magnetic resonance imaging.

