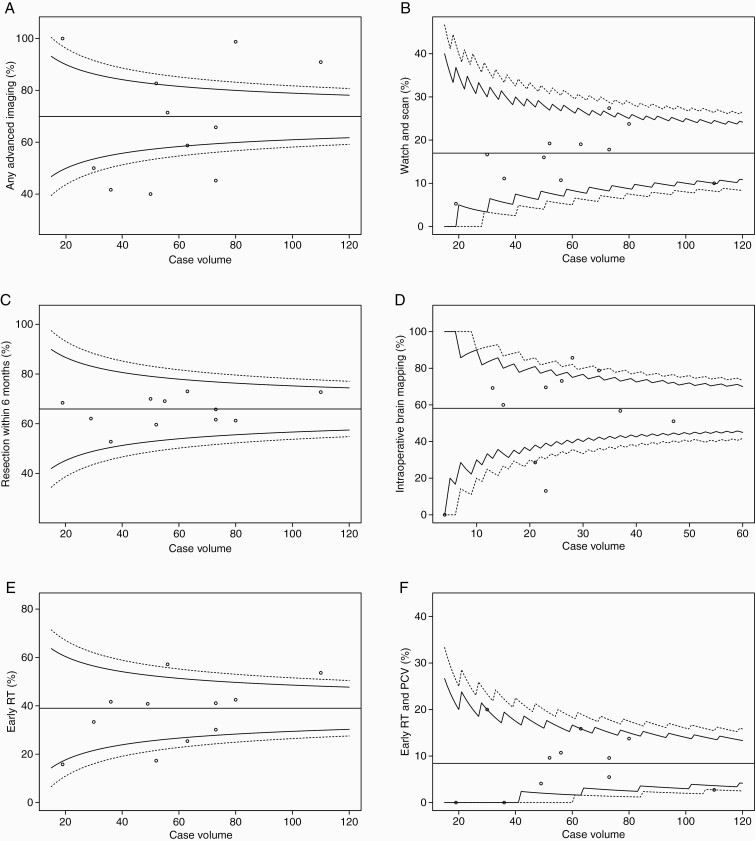
Figure 2.
Funnel plots displaying rates of (A) advanced preoperative imaging (diffusion tensor imaging [DTI], functional MRI [fMRI], MR spectroscopy [MRS], positron emission tomography [PET]), (B) watch-and-scan, (C) resection rates within 6 months from radiological diagnosis, (D) intraoperative brain mapping during primary resections in presumed eloquent locations, (E) early radiotherapy, and (F) early postoperative radiotherapy plus PCV (procarbazine, lomustine, vincristine) plotted against case volume at each of the 11 treating centers. The target outcome for Y (horizontal solid line) is the observed overall proportion in percentage. The solid funnels represent 95% control limits, while the dotted funnels represent 99% control limits.

