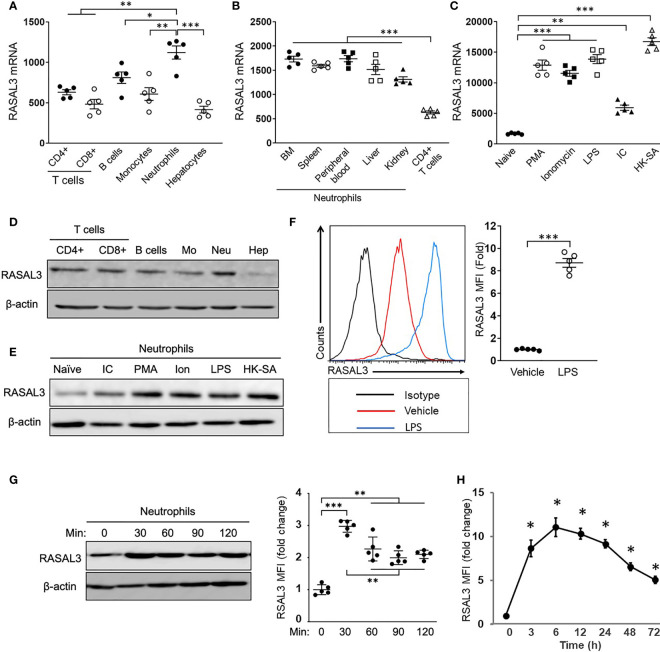
Figure 1.
RASAL3 is dominantly expressed in neutrophils and is upregulated by cellular activation. (A, B) The characterization of RASAL3 mRNA expression (relative to GAPDH). Total RNA was isolated from each cell population, and RASAL3 mRNA expression was measured by real-time PCR. Basal expression level of RASAL3 mRNA in splenic T cells (CD4+ T, CD8+ T), bone marrow (BM) monocytes, BM neutrophils and hepatocytes (A), (B) A comparison of RASAL3 mRNA expression in neutrophils isolated from different tissues (from BM, spleen, peripheral blood, live, kidney). Splenic CD4+ T cells were used as control. (C) RASAL3 mRNA expression in stimulated neutrophils. BM neutrophils were stimulated with indicated agonists at 37°C for 3 h: PMA (500 ng/mL), Ionomycin (1 µg/mL), Lipopolysaccharide (LPS) (1 µg/mL), polyinosinic-polycytidylic acid (IC) (BSA 1 µg + anti-BSA mouse IgG 10 µg) and heat killed methicillin resistant S. aureus, strain USA400 (106 CFU/mL). PBS was used as vehicle control. (D) RASAL3 protein level in neutrophil populations as determined by Western blotting. Representative blots are shown from cells obtained as described in (A). (E) RASAL3 protein expression in bone marrow isolated neutrophils at baseline (naïve) and upon stimulation with various stimuli for 3 h as described in (C). (F) RASAL3 protein expression as determined by intracellular staining with flow cytometry analysis. Bone marrow purified cells were stimulated with vehicle or LPS. After 3 h, cells were harvested, washed and stained intracellularly for RASAL3 expression. Data are shown as mean fluorescence intensity (MFI) of expression. (G, H) Time-course of RASAL3 protein expression by neutrophils after stimulation with LPS. In (G), neutrophils were stimulated for 30, 60, 90 and 120 minutes. At indicated times, cells were collected and subjected to Western blotting. Protein expression is indicated relative to baseline (unstimulated). In (H), WT mice were challenged in vivo (i.p) with LPS. At indicated times, peripheral blood was collected, and RASAL3 protein expression was determined by flow cytometry. Data are presented as fold change in MFI relative to time 0 (before stimulation). The data are shown as mean ± SEM. Each experiment was performed at least two independent times with identical results. n = 5. Each symbol represents independent measurement from one mouse. Values of *p < 0.05, **p < 0.01 and ***p < 0.001.

