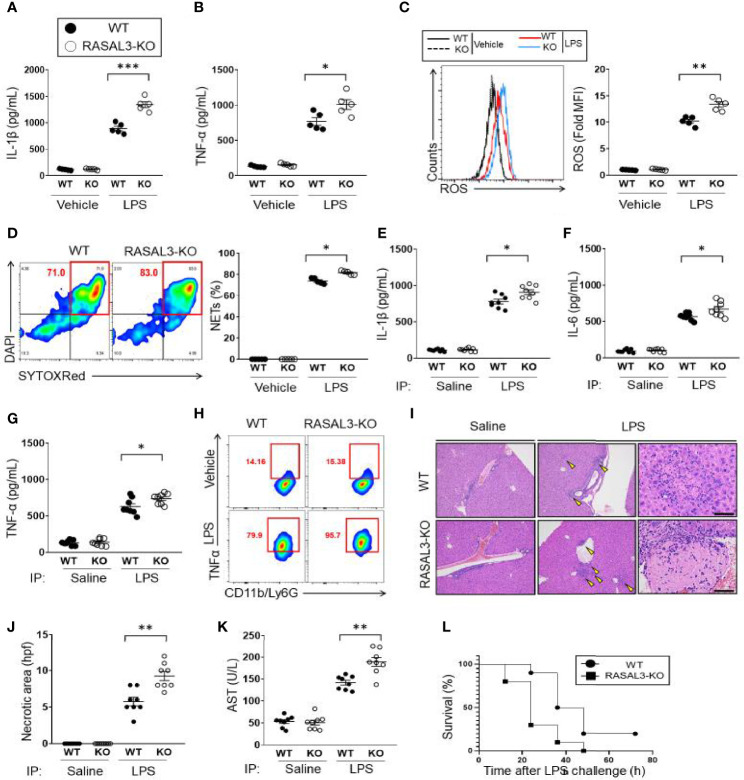
Figure 3.
RASAL3-deficiency exaggerates inflammatory response in neutrophils. (A, B) Inflammatory cytokine production in neutrophils. Bone marrow isolated neutrophils were incubated with vehicle control or LPS at 37°C for 24 h. The production of IL-1β (A) and TNF-α (B) were detected by ELISA. (C, D) ROS production in neutrophils. BM isolated neutrophils were incubated with vehicle control or LPS at 37°C for 30 min. Flow cytometry was used to determine CellROX-Green assay fluorescence. A representative flow cytometric plot and calculated mean fluorescence intensities (MFI) are shown. (D) NET production by BM isolated neutrophils. After treatment with vehicle or LPS, SYTOXRed+DAPI+ cells were quantified as fraction of neutrophils undergoing NETosis. E-H). In vivo cytokine production by WT and RASAL3-KO mice. Mice received i.p. injection of LPS or saline (vehicle control). At 12 h, serum was collected, and IL-1β (E), IL-6 (F), TNF-α (G) were measured by ELISA. (H) Intracellular cytokine (TNF- α) measurement of neutrophils in LPS-challenged WT and RASAL3-KO mice. 6 h after LPS challenge (or control injection), blood was harvested from WT and RASAL3-KO mice, and the proportion of neutrophils (C11b/Ly6G) staining positive intracellular TNF-α were determined by flow cytometry. (I) Representative H&E histological analysis of liver necrosis in WT and RASAL3-KO mice in control and LPS challenged mice. (J) Quantification of liver necrotic areas per high power field (hpf) are shown for WT and RASAL3-KO mice 12 h after LPS challenge (K). ELISA measurement of serum aspartate aminotransferase (AST) in WT and RASAL3-KO mice 12 h after LPS challenge. (L) Kaplan-Meier survival curve analysis for WT and RASAL3-KO mice after LPS challenge (0 through 72 h). Except for L, all data are shown as the mean ± SEM. n=5-10 samples from at least two independent experiment. *p < 0.05, **p < 0.01 and ***p < 0.001.

