Figure 4.
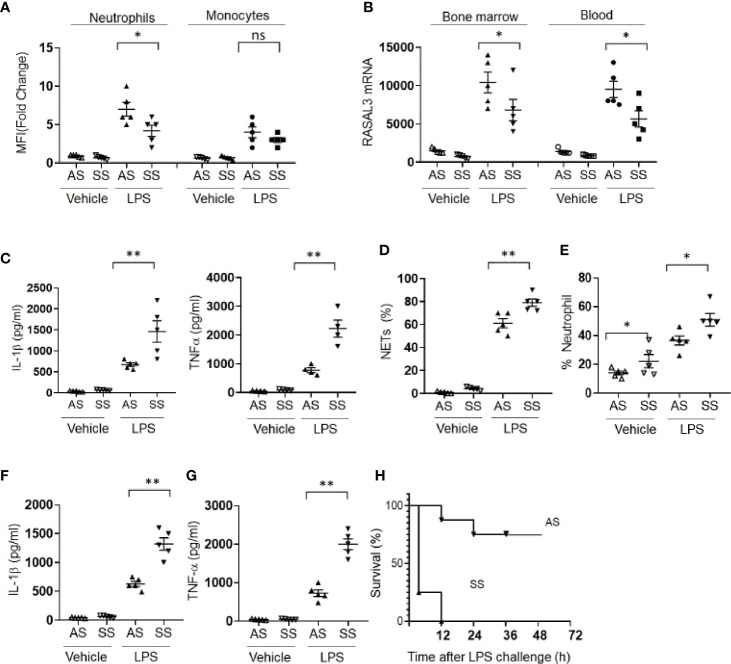
RASAL3 deficiency drives hyperinflammation in sickle cell disease. (A) RASAL3 protein expression in BM neutrophils and monocytes from littermate sickle cell Townes (SS) and heterozygotes (AS). 3 h after LPS challenge, mice were sacrificed, and cells were obtained for analysis. Data are represented as fold change in mean fluorescence intensity (MFI) relative to expression levels in unstimulated cells. (B) RASAL3 mRNA in bone marrow and circulating blood neutrophils of AS and SS at baseline, and 3 h after LPS challenge. (C) Inflammatory cytokine production in neutrophils from AS and SS mice at baseline and after LPS challenge. Bone marrow isolated neutrophils were incubated with vehicle control or LPS at 37°C for 24 h. The production of IL-1β, TNF-α were detected by ELISA. (D) NET production was determined by flow cytometric assessment for SYTOXRed+DAPI+ neutrophils after LPS or vehicle challenge. (E) Proportion of neutrophils in the circulation of AS and SS at baseline and after i.p. LPS injection (6 h). (F, G) Inflammatory cytokine production in vivo by AS and SS mice upon challenge with LPS. IL-1β (F) and TNF-α (G) levels in the blood were measured by ELISA. (H) Kaplan-Meier survival curve of AS and SS after LPS challenge in vivo (n=10 per group). Except H, data are shown as the mean ± SEM. Each symbol represents one mouse. Each experiment was performed at least two independent times. *p < 0.05 and **p < 0.01. NS, not significant.

