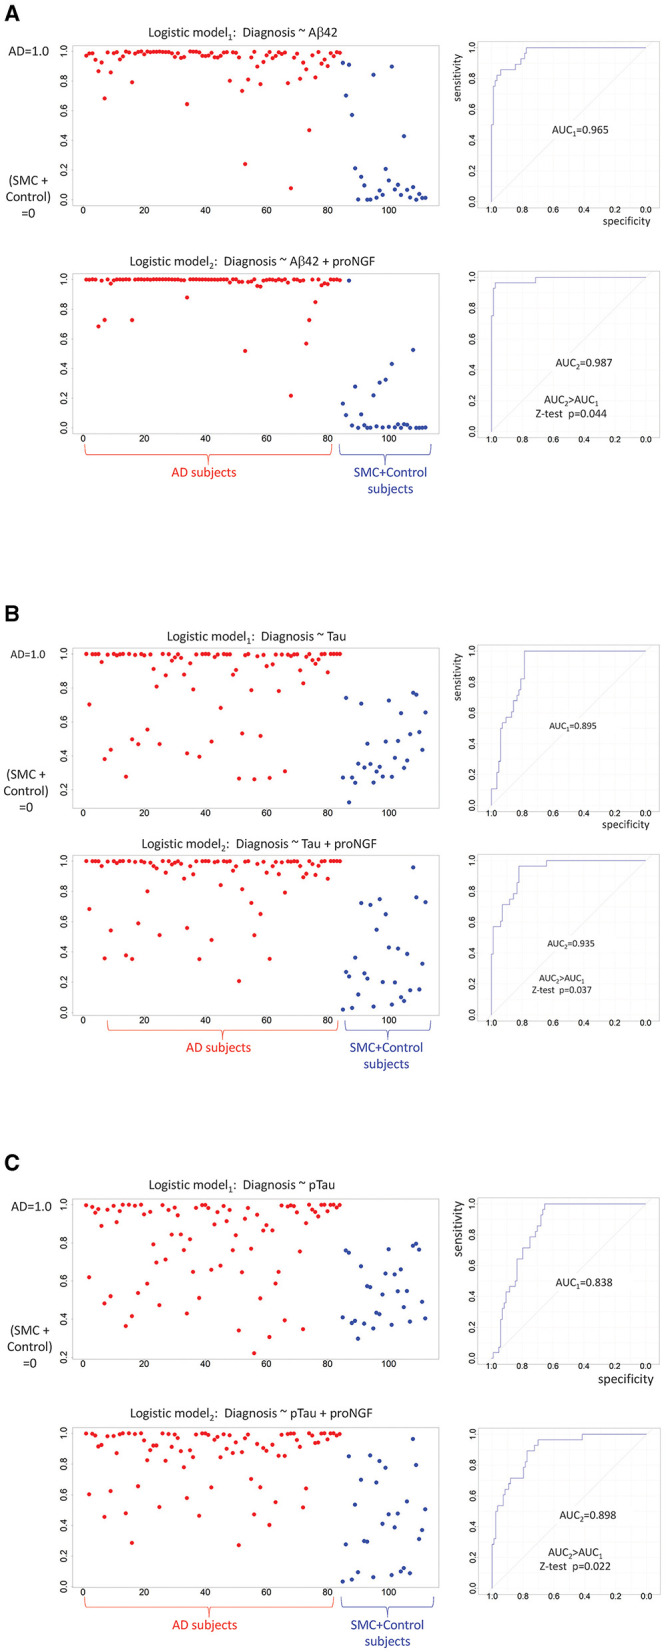
Figure 4.

Diagnostic predictions of logistic models: binarized response variable (AD = 1 vs. SMC + control = 0) is predicted by standardized Aβ42 (A), by standardized Tau (B), by standardized pTau (C), and proNGF measures. For each panel, the predicted logistic scores are plotted on the left (AD subjects in red, SMC + control subjects in blue), while the model performances are shown on the right. The two ROC curves are compared by a one-sided Z-test (AUC2 > AUC1).
