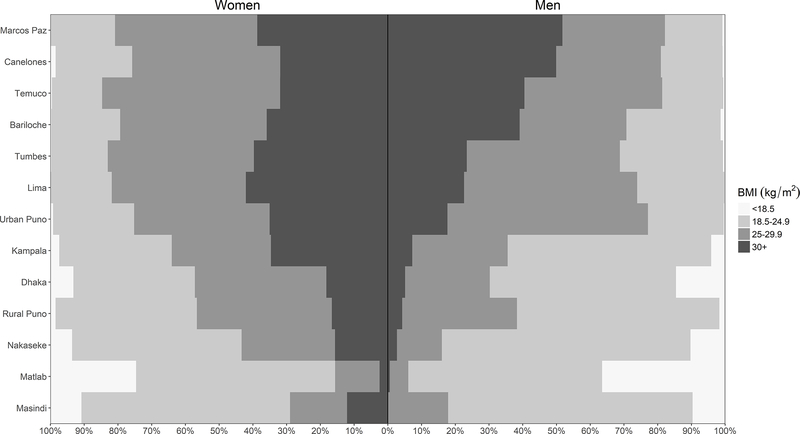
Figure 1: Sex-, site- and category-stratified prevelances of Body Mass Index (BMI).
The prevalence of BMI was stratified by sex (women on the left, men on the right) and WHO classification for underweight, normal, overweight, and obese individuals (BMI between 0–18.5, 18.5–25, 25–30, and over 30 kg/m2, respectively) across the 13 LMIC sites. Sites were ordered according to the overall prevalence of Obesity in Men from highest (top) to lowest (bottom).

