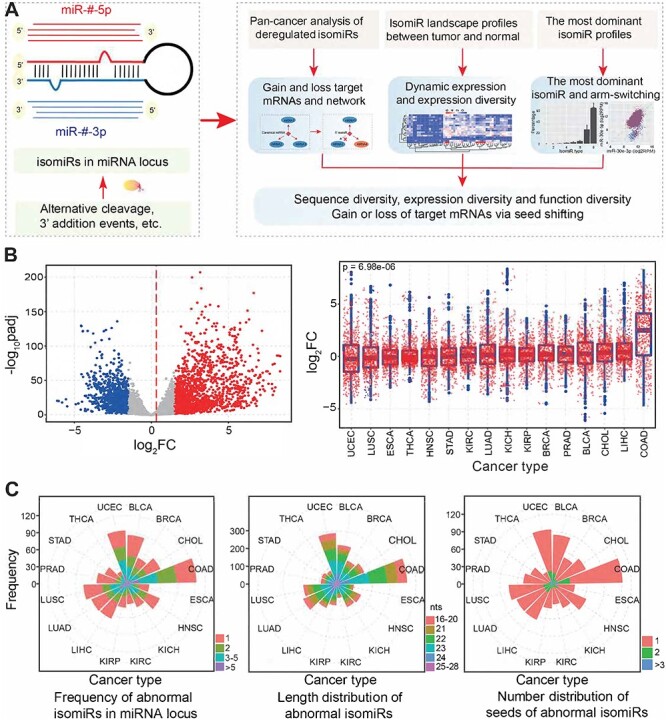
Figure 1 .

Systematic characterization of deregulated isomiRs across cancer types. (A) The phenomenon of multiple isomiRs in a miRNA locus. This study mainly includes three sections to explore isomiRs: pan-cancer analysis of deregulated isomiRs, isomiR landscape profiles compared between tumor and normal samples and the most dominant isomiR expression profiles. (B) The scatter plot shows the distributions of log2FC and –log10padj values based on differential expression analysis at the isomiR level (the baseMean value in DESeq analysis of each isomiR is more than 100 in one or more cancer types). The mean value of log2FC is shown using a red dashed line. Blue dots indicate significantly downregulated isomiRs, grey dots indicate normally expressed isomiRs and red dots indicate significantly up-regulated isomiRs. The box plots (right) indicate the detailed distribution of log2FC across cancer types. The P-value is estimated using a trend test based on the median of log2FC. FC, fold change in expression; padj, adjusted P-values. (C) Distributions of the frequency of differentially expressed isomiRs in miRNA loci, length of abnormal isomiRs and number of involved seeds in miRNA loci across cancers.
