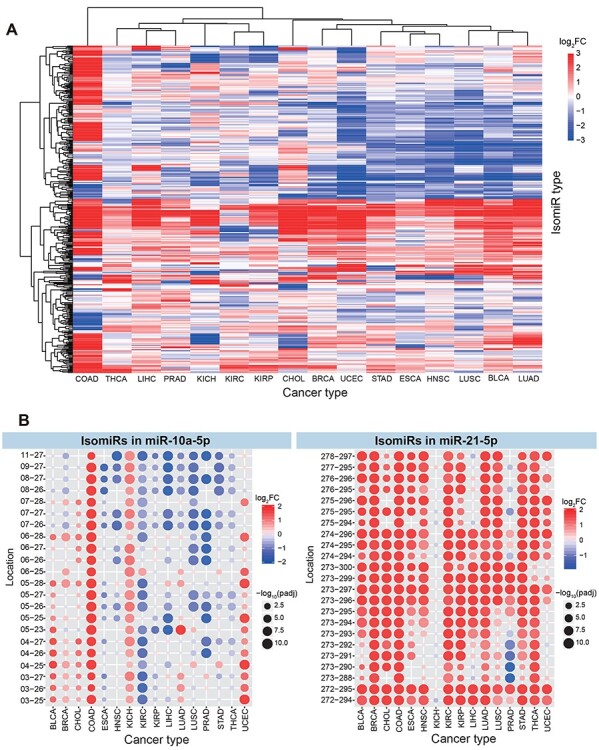
Figure 2 .

IsomiR expression patterns across different cancer types. (A) Clustering analysis of differentially expressed isomiRs indicates dynamic expression (these isomiRs are abundantly expressed species, and the baseMean value of each isomiR is more than 1000 in one or more cancer types). (B) Specific examples of differentially expressed isomiR profiles in miR-10a-5p and miR-21-5p loci. For example, miR-10a-5p, 03-25 indicates the locus hg38:chr17:48579903-48579925:− and miR-21-5p, 272-294 indicates the locus hg38:chr17:59841272-59841294:+.
