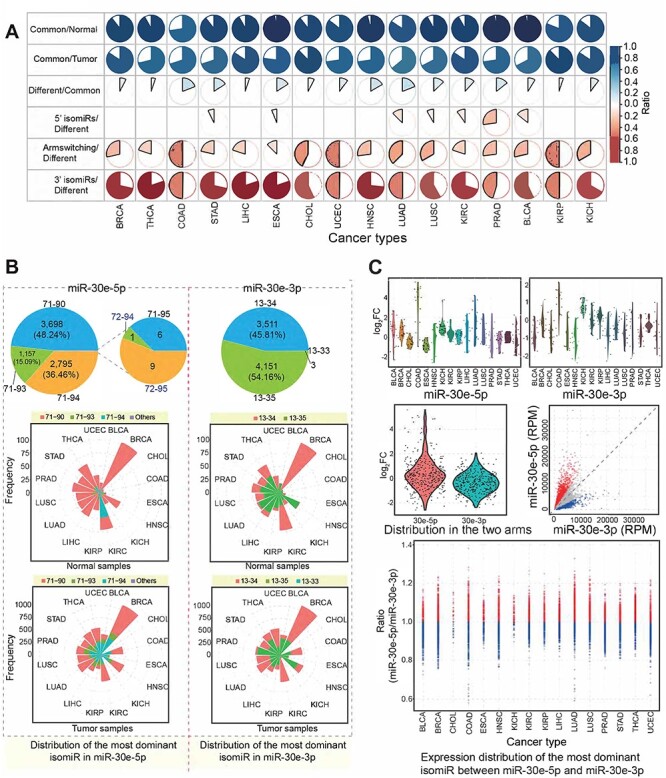
Figure 5 .

Dominant isomiR sequence analysis and arm-switching phenomenon based on pre-miRNA. (A) Pie charts indicate change in number of isomiRs across different cancer types. ‘Common’ indicates number of dominant isomiRs shared between tumor and normal samples, ‘normal’ indicates number of dominant isomiRs in normal samples, ‘tumor’ indicates number of dominant isomiRs in tumor samples and ‘different’ indicates number of dominant isomiRs differing between tumor and normal samples. (B) Frequency distributions of the most dominant isomiRs from miR-30e-5p and miR-30e-3p (based on frequencies of samples). These involved isomiRs were found to be the most dominant isomiRs in specific samples, and the detailed distribution across cancer types is also presented. 71-90 indicates a location of hg38:chr1:40754371-40754390:+, and 13-33 indicates hg38:chr1:40754413-40754433:+. (C) Distribution of abnormally expressed isomiRs from two arms of mir-30e. Scatter plot indicates expression variation between miR-30e-5p and miR-30e-3p across cancer types based on expression levels of the most dominant isomiRs generated from miR-30e-5p and miR-30e-3p.
