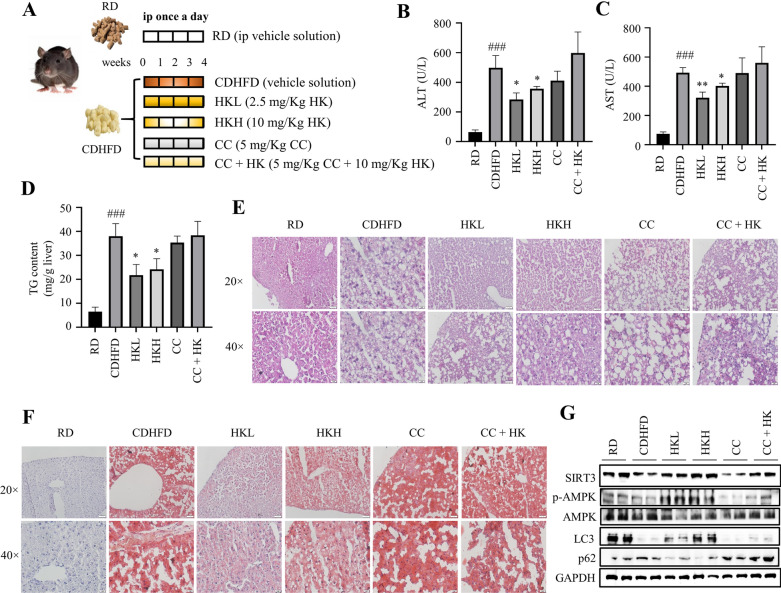
Fig. 5.
HK alleviate liver steatosis in CDHFD-fed mice. A The experimental procedure. HKL: 2.5 mg/Kg HK; HKH: 10 mg/Kg HK; CC: 5 mg/Kg CC; CC + HK: 5 mg/Kg CC and 10 mg/Kg HK. n = 3‒5. B Serum ALT levels in mice. C Serum AST levels in mice. D TG content in the liver. E Representative images of H&E staining of the liver. Scale bar = 50 µm (top); scale bar = 20 µm (bottom). F Representative images of Oil-red O staining of the liver. Scale bar = 50 µm (top); scale bar = 20 µm (bottom). G The expression levels of p-AMPK, AMPK, LC3, p62, PLN2, HSC70, LAMP2 and SIRT3 in the liver were determined by Western blots. GADPH was used as a loading control. Data are shown as mean ± SD. *p < 0.05 and **p < 0.01, HK vs. CDHFD. ###p < 0.001 RD vs. CDHFD. One-way ANOVA was used to calculate the p-values

