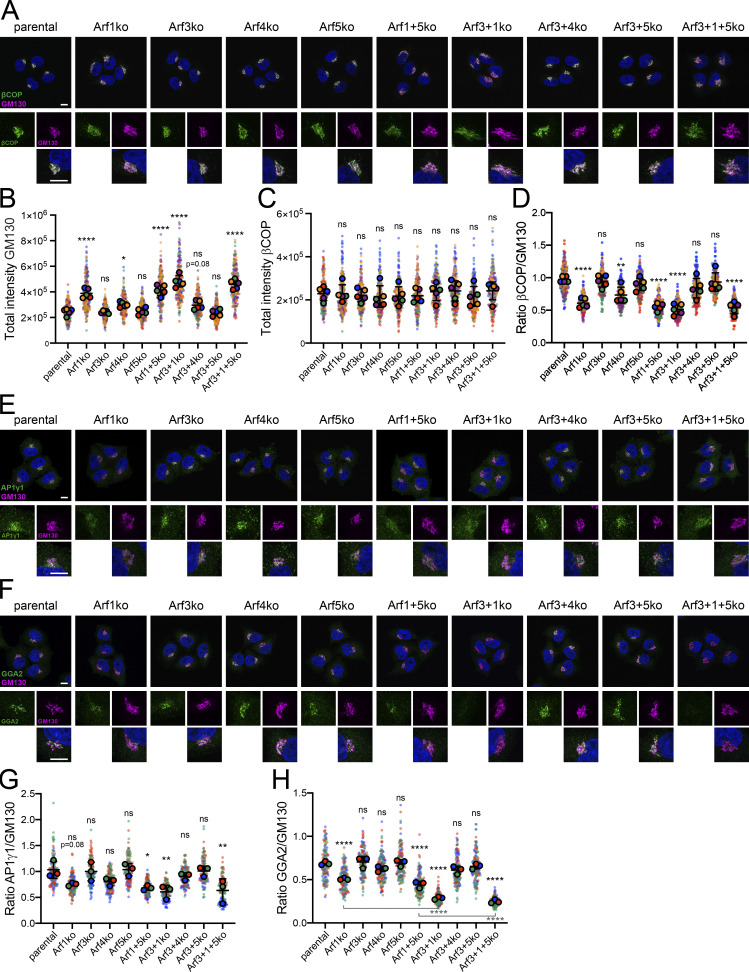
Figure 4.
Immunostaining for Golgi associated coat proteins. (A) All Arf KO cell lines as well as parental HeLaα cells were coimmunostained for the Golgi marker GM130 in magenta and the coat component βCOP in green to examine their steady-state localization. DAPI signal is shown in blue. Lower panels show magnified image sections. Scale bars, 10 µm. (B–D) The total fluorescence intensity of perinuclear GM130 (B) and βCOP (C), and the ratio of βCOP to GM130, i.e., the density of βCOP per Golgi unit (D), were quantified. Average values obtained from five independent experiments with >40 Golgi analyzed per cell line and experiment are shown as filled circles together with the values from individual cells as small dots colored by experiment. Two of the five experiments were acquired later (violet and orange) and, due to technical offset, were mathematically corrected by a factor determined from the average ratios of the parental cells. Mean ± SD of the five experiments are indicated. Unpaired one-way ANOVA versus parental (ns, P > 0.05; *, P < 0.05; **, P < 0.01; ****, P < 0.0001). (E and F) The cell lines were stained for GM130 and AP1γ1 (E) or GGA2 (F) and imaged as in A. (G and H) The ratio of fluorescence intensity of AP1γ1 (G) or GGA2 (H) to GM130 was quantified as in D. Average values from three independent experiments with >40 Golgi analyzed per cell line and experiment are shown as filled circles together with the values from individual cells as small dots colored by experiment. Mean ± SD of the three experiments are indicated. Unpaired one-way ANOVA versus parental, unless indicated otherwise (ns, P > 0.05; *, P < 0.05; **, P < 0.01; ***, P < 0.001; ****, P < 0.0001).

