
Figure 5 .
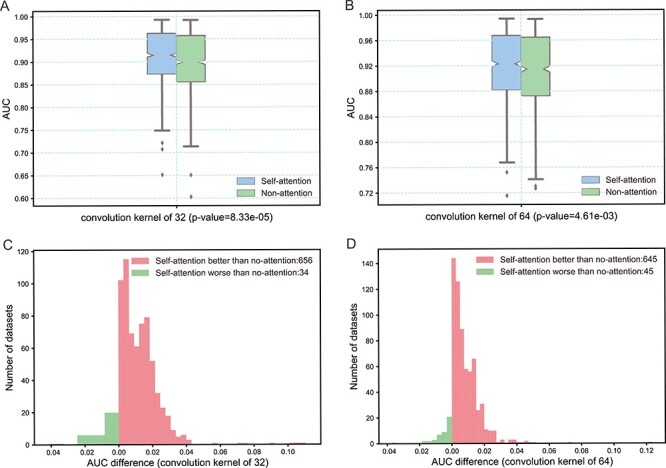
Performance comparison the models trained with and without the self-attention module. Panels A and B, respectively, compare the AUC distribution of the models with different convolution quantities under the two conditions with and without the self-attention mechanism. On each box, the intermediate mark indicates the median, and the top and bottom edges of the box indicate the upper and lower quartiles, respectively. The upper and lower sides indicate the upper and lower limits, while the diamond marks indicate outliers. Panels C and D, respectively, show the performance improvement effect of the model with self-attention mechanism compared with the no-attention model on 690 ChIP-seq datasets through histograms. The x-axis represents the AUC difference between the self-attention and no-attention model. In panel C, the models with the self-attention mechanism outperformed the no-attention models on 656 datasets, but performed worse than the no-attention models on 34 datasets. Similar results are shown in panel D.