FIGURE 2.

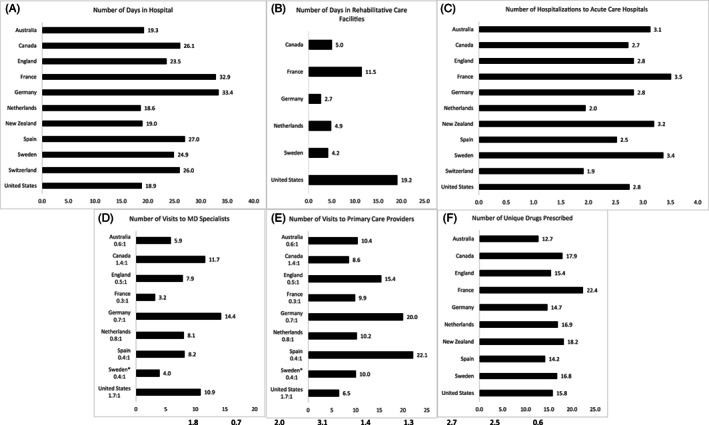
Differences in utilization of health care services over 365 days. Primary care visits for Sweden represent average yearly consumption for this cohort rather than linked patient‐level data

Differences in utilization of health care services over 365 days. Primary care visits for Sweden represent average yearly consumption for this cohort rather than linked patient‐level data