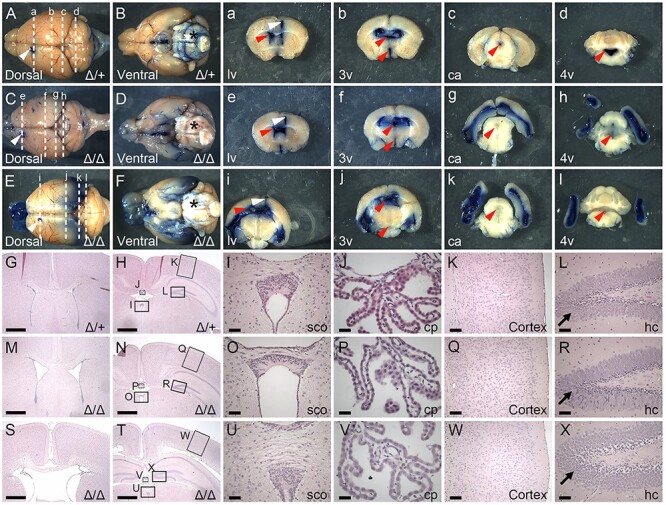
Fig. 1.

Loss of B3glct impairs CSF flow. (A–F and a–l) Representative images taken 10 min following injection of Evans Blue dye into the anterior horn of the left lateral ventricle (lv) (White arrowhead) at 5 weeks of age. (A, C, E) Dorsal and (B, D, F) ventral whole brain views with anterior to left and posterior to right. (a–l) Thick coronal sections of whole brains with approximate locations of the plane of sectioning indicated by dashed lines in A–F. White arrowhead indicates dye injection site. Red arrowheads indicate respective ventricles or central aqueduct. (A, B and a–d) In control brains (Δ/+) (n = 5), Evans blue dye flowed through the ventricular system and was detected in the lateral (lv), third (3v), central aqueduct (ca) and fourth (4v), as well as in the perivascular space (*) on the surface of the brain. (C–F and e–l) In contrast in B3glct knockout (Δ/Δ) (n = 4) brains, dye accumulated in the lateral ventricles with reduced flow to the third and fourth ventricles in moderate ventriculomegaly (C, D and e–h) and severe hydrocephalus (E, F and i–l) brains. (G–X) Hematoxylin and eosin staining of coronal sections from postnatal day 21 (P21) control (Δ/+) (G–L), B3glct knockout (Δ/Δ) with mild ventriculomegaly (M–R) and B3glct knockout (Δ/Δ) with severe hydrocephalus (S–X) animals. (G, M, S) Sections taken through lv and (H, N, T) sections through 3v. Arrows in panels L, R and X indicate granular layer in dentate gyrus in hippocampus. Boxes in panels H, N and T indicate regions expanded in panels I–L, O–R and U–X. Abbreviations: cp, choroid plexus; sco, subcommissural organ; hc, hippocampus. Scale bars: panels G, H, M, N, S and T 1 mm; panels I, O, U, L, R, X 100 μm; panels J, P, V 50 μm; and K, Q, W 200 μm.
