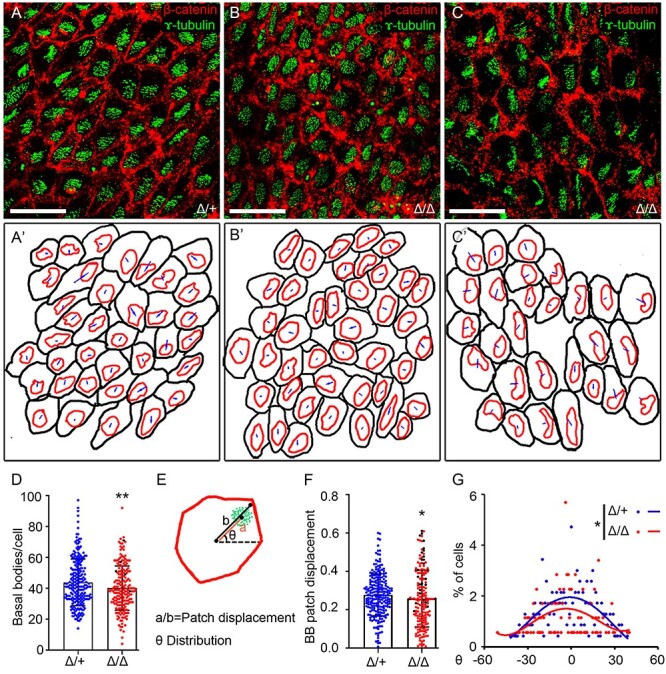
Fig. 3.

Loss of B3glct decreases number of basal bodies and alters translational polarity in ependymal cell. Analysis of cell polarity in P21 lateral ventricles. (A–C) Representative maximum projection images of P21 whole-mount brain lateral ventricular walls stained with γ-tubulin (green) to detect basal bodies and β-catenin (red) to identify cell borders in (A) B3glct control (Δ/+), (B) and B3glct knockouts (Δ/Δ) with mild ventriculomegaly, or (C) severe hydrocephalus. (A′–C′) Representative tracings of cells in maximum projection images used to calculate basal body patch displacement and theta distribution. (D) Total basal bodies per ependymal cells. (E) Cartoon depicting cell measurements used to calculate basal body patch displacement (a/b) (F) and theta angle (G). (D, F, G) Blue indicates B3glct control (Δ/+), red indicates B3glct knockout (Δ/Δ) with mild ventriculomegaly and black indicates B3glct knockout (Δ/Δ) with severe hydrocephalus. Data were evaluated for statistical significance using unpaired, two-tailed t-test (D), Mann–Whitney test (F) and Watson’s two-sample U2 test (G). *P ≤ 0.05, **P ≤ 0.01. Scale bars: panel A–C 20 μm.
