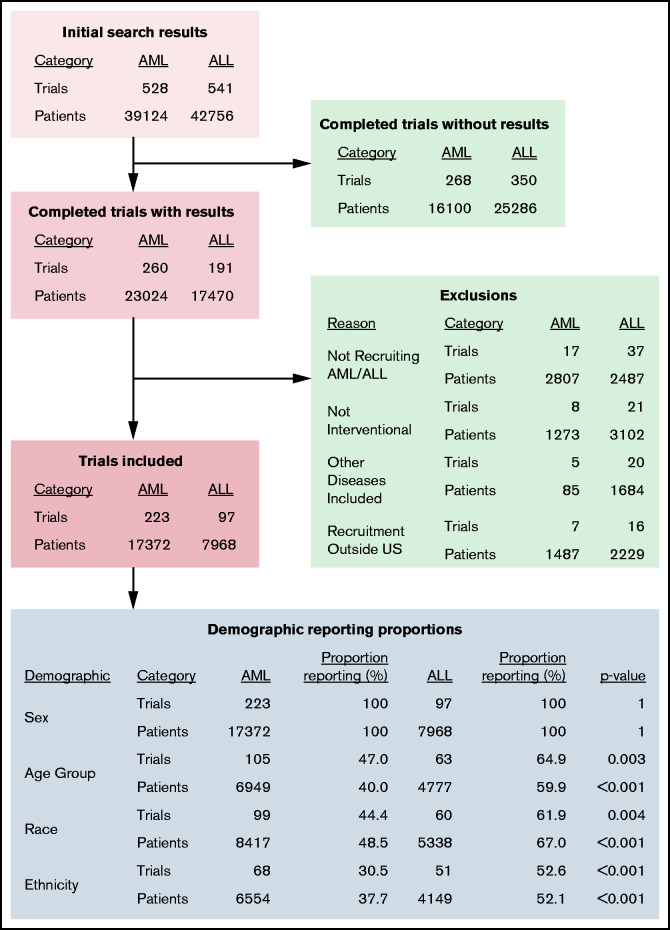
Figure 1.
ClinicalTrials.gov search results schema and demographic reporting proportions for included trials. Excluded trials are shown in the green boxes and were excluded for not reporting results (top) or for the specific reason listed (bottom). Demographic reporting proportion comparisons (blue box) were performed between AML and ALL trial and patient proportions by using two-sided z-tests.

