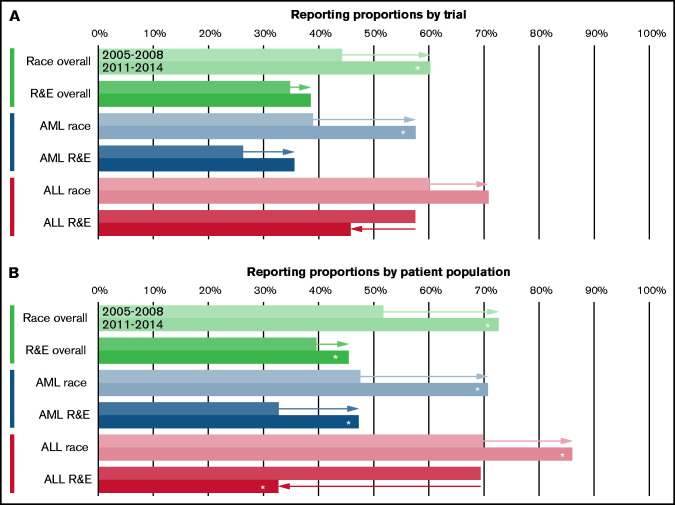
Figure 3.
Changes in Race and Race-Ethnicity Reporting Proportions Between 2005-2008 and 2011-2014. Dyadic bar chart of reporting proportions of race and race-ethnicity according to trial (A) and patient population (B) between the periods before (2005-2008; top bars) and after (2011-2014; bottom bars) implementation of the reporting requirements. Proportions are shown overall and for AML and ALL individually. Arrows indicate the direction of change between the periods, and asterisks denote significance below the level of P = .05 (two-sided z-test). R&E, race and ethnicity.

