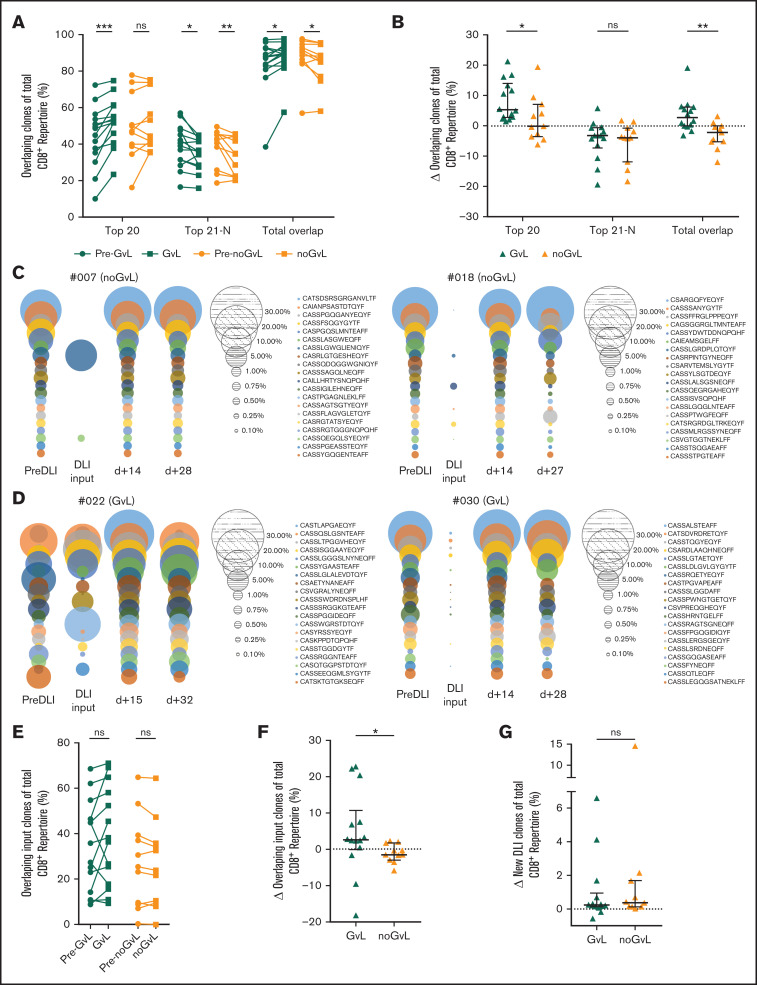
Figure 5.
Overlapping clones are expanding in patients with GVL effect. Identical CD8+ clones present in more than 1 time point of individual patients (longitudinal intrapatient comparison) were defined as overlapping clones. (A) Top 20, 21 to N, and total overlapping CD8+ T-cell clones as percent of total CD8+ TRB repertoire (y-axis) are shown for patients with GVL (green; n = 14) and without GVL (orange; n = 11). Two time points are compared, with closed circles displaying the pre-GVL/pre-noGVL time point and closed squares displaying the first onset of GVL/comparable time point in patients without GVL. (B) Change of overlapping CD8+ TRB repertoire proportions is compared between patients with GVL (green) and those without GVL (orange). (C-D) Overlapping repertoire over time of the top 20 CD8+ T-cell clones of 2 representative patients without GVL (C) and with GVL (D) are displayed. Each circle represents 1 CD8+ T-cell clone, with the size matching the abundance of the total CD8+ TRB repertoire at that time point. (E) Proportion of overlapping CD8+ T-cell DLI clones in patients with first occurrence of GVL effect (green) and those without (orange). Shown is the sample with first occurrence of GVL/noGVL (closed squares) in comparison with the time point pre-GVL/pre-noGVL (closed circles) for each patient. At occurrence of first GVL, overlapping DLI clones showed a trend to expand (P = .0651) but not in noGVL samples (P = .3086). (F) Change of overlapping DLI CD8+ T-cell clones between first pre-GVL/pre-noGVL and GVL/noGVL time point is shown for patients with GVL (green) and without GVL (orange); P = .0128. (G) Change of new DLI CD8+ T-cell clones (clones were not detected in pre-DLI sample) between all pre-GVL/pre-noGVL and all GVL/noGVL time points is shown for patients with GVL (green) and without GVL (orange); P = .7780. In the multivariate variate analysis of this comparison, GVL contributed significantly to the model (P = .0415; Table 3; supplemental Table 5N). Statistical analysis was performed by Wilcoxon matched-pairs signed ranked test (two-tailed) (A, E) and Mann-Whitney test (two-tailed) (B, F-G). Black lines represent median; error bars show the interquartile range. *P < .05; **P < .01; ***P < .001; ns, not significant.

