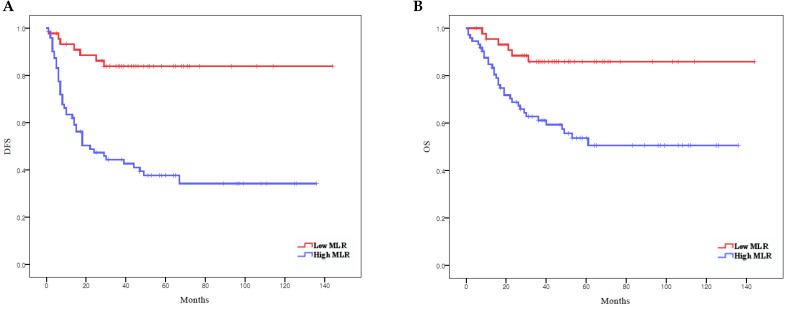
Figure 2.
Survival curves according to MLR: (A) Kaplan-Meier survival curves for DFS of patients with a high MLR and those with a low MLR. (B) Kaplan-Meier survival curves for OS of patients with a high MLR and those with a low MLR. DFS, disease-free survival; OS, overall survival; MLR, monocyte-to-lymphocyte ratio.

