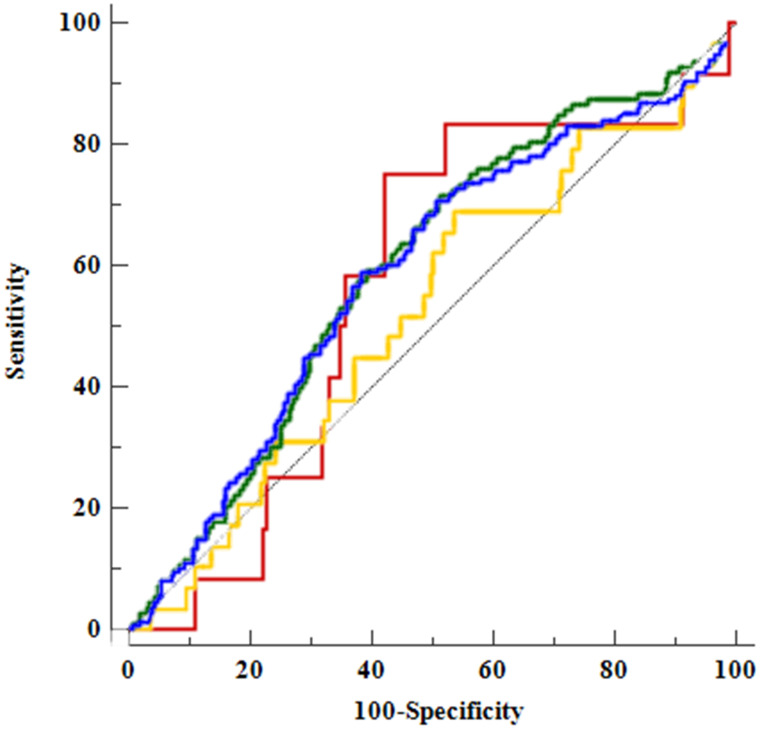
Figure 2.
Comparison of areas under the receiver operating characteristic (ROC) curve (AUCs) for the fat-to-muscle ratio and among the factors associated with coronary artery disease using ROC curves. The AUC for CACS, 0.59 (95% confidence interval [CI], 0.55-0.63), is denoted by a blue line; that for high CACS, 0.52 (95% CI, 0.48-0.56), is denoted by a yellow line; that for atheroma, 0.60 (95% CI, 0.56-0.64), is denoted by a green line; and that for OCAD, 0.57 (95% CI, 0.53-0.61), is denoted by a red line.

