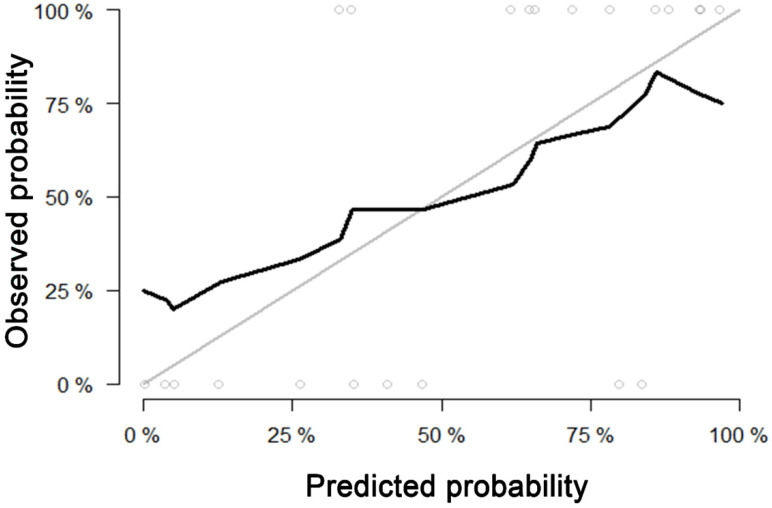
Figure 2.
Calibration curve of the model built by logistic regression for predicting fibrosis. Calibration curve depict the calibration of model in terms of the agreement between the predicted probability and observed probability. The black solid line represents the performance of the model, which was closer to the diagonal grey solid line represents a better prediction. The Hosmer-Lemeshow test yielded a non-significant statistics for the model (p= 0.472), which suggested that there was no departure from perfect fit.

