Figure 3.
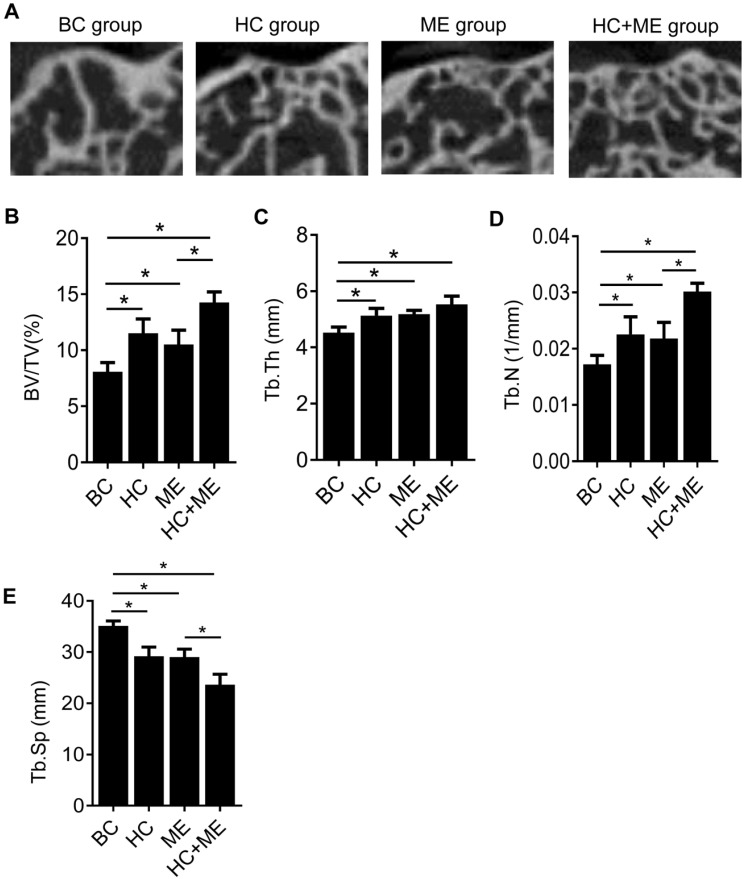
MicroCT analysis of the subchondral bone at the injury site and the correlation between articular cartilage thickness and relative bone volume (BV/TV). Representative micro-CT images of the distal femur in mice were shown (A). Quantitative analyses of trabecular bone volume fraction (BV/TV) (B), trabecular thickness (Tb.Th) (C), trabecular number (Tb.N) (D), and trabecular separation (Tb.Sp) (E). Data are represented as mean ± s.e.m. (*p< 0.05).

