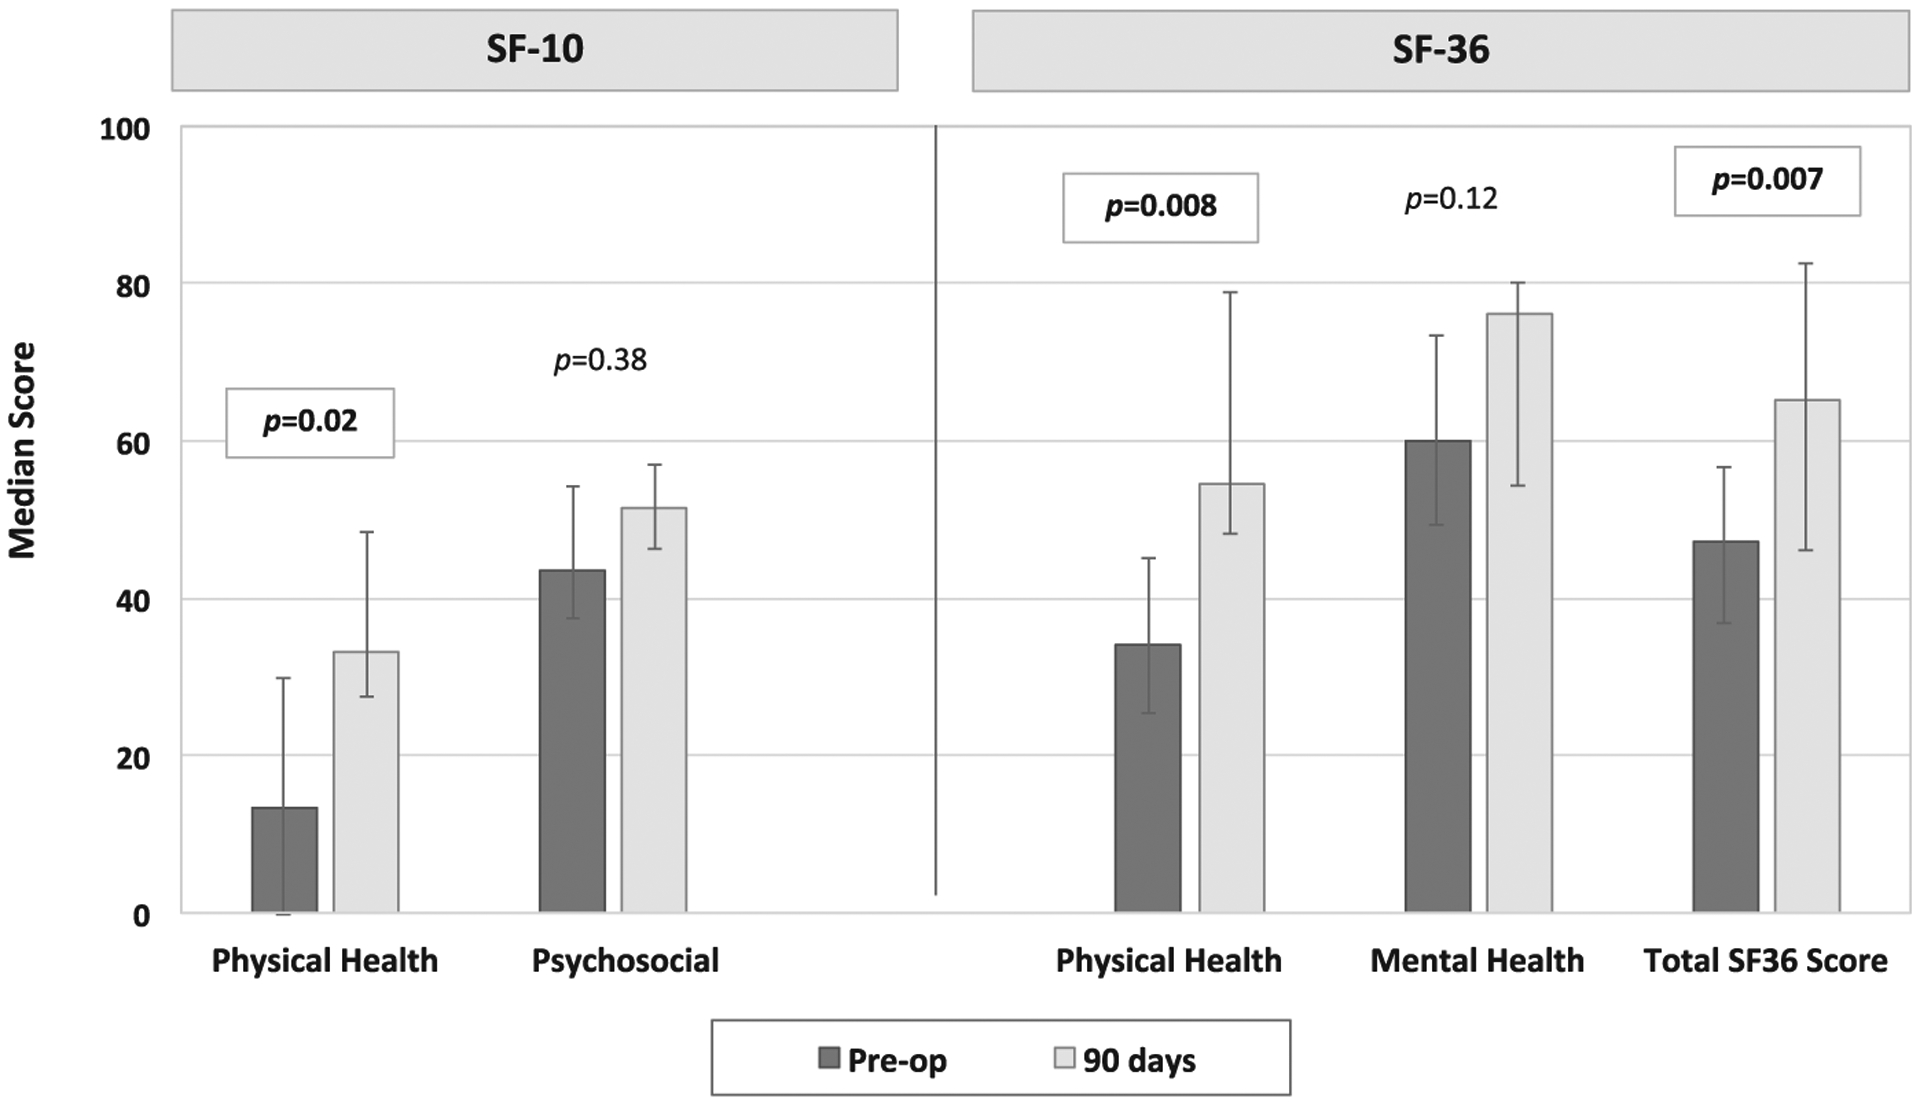
FIGURE 3.

Health-related quality of life preoperatively and postoperatively. This figure compares health-related quality of life scores in patients preoperatively and at 90 days postoperatively. The SF-10 was completed for patients <12 years of age. The SF-36 was completed for patients 12 years and older. The bars in the figure represent median scores, and the error bars demonstrate the IQR. SF-10 physical health scores and SF-36 physical health module scores and total scores significantly improved at 90 days postoperatively
