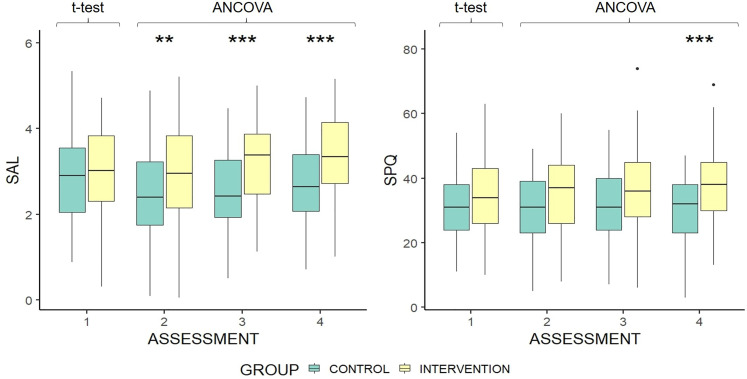
Figure 3.
Boxplots of social activity log & social participation questionnaire score by group and assessment. Group difference at baseline is based on independent samples t-test. Differences at each subsequent time point are controlled for baseline scores. Higher scores indicate greater social activity. *p < .05 **p < .01 ***p < .001. The upper and lower hinges represent 25th and 75th percentiles, respectively. The upper whisker is highest value within 1.5 × interquartile range, measured from the upper quartile. The lower whisker is the lowest value within the 1.5 × interquartile range, measured from the lower quartile. Values beyond this are represented as outlier dots.

