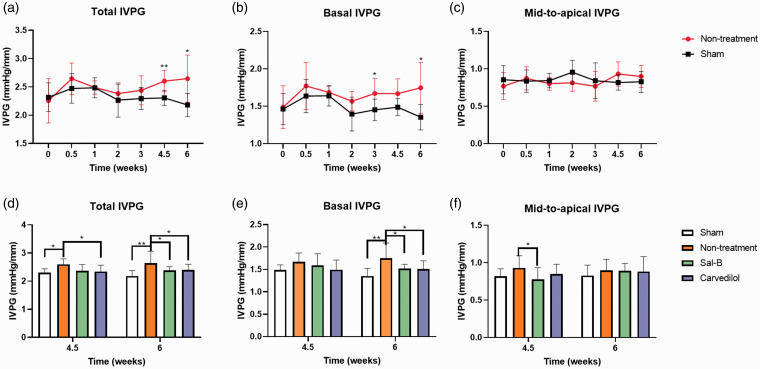
Figure 5.
Comparison of IVPG results in different groups at different time intervals. A, B, & C graphs, respectively, represent the Total, Basal, and Mid-to-apical IVPG parts in Sham and Non-treatment groups throughout the entire experiment. D, E & F graphs, respectively, summarized the Total, Basal, and Mid-to-apical IVPG parts at 4.5 and 6 weeks in all groups. *p < 0.05 and **p < 0.01 used to compare the significance between groups.

