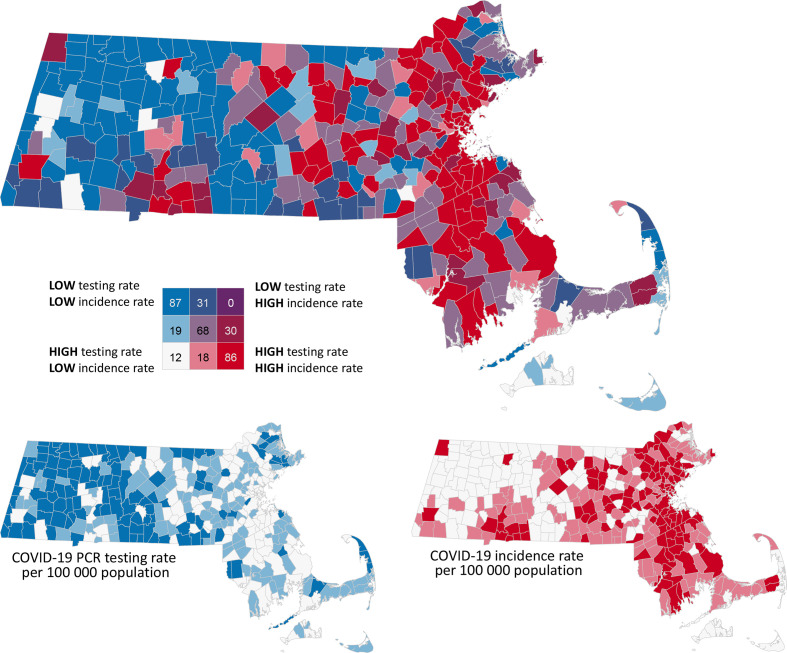
Figure 3.
Bivariate geographic distribution between the rate of SARS-CoV-2 molecular polymerase chain reaction (PCR) testing and rate of SARS-CoV-2 incidence, by city/town, Massachusetts, February 1–June 17, 2020. Tertiles classification was used to enable comparison of the distribution of the 2 variables (incidence rate and testing rate). Town counts shown for each category. The distribution of confirmed COVID-19 cases is complex and depends on a combination of interacting factors, including socioeconomic conditions, underlying health, health care access, and testing capacity. Comparing a single variable, COVID-19 testing rate is only part of the story and should be interpreted with caution. Data sources: Massachusetts Department of Public Health data from February–June 17, 2010 14 ; Centers for Disease Control and Prevention/Agency for Toxic Substances and Disease Registry Social Vulnerability Index 2018 for Massachusetts transformed to Massachusetts town level 17 ; and University of Massachusetts Donahue Institute. 16

