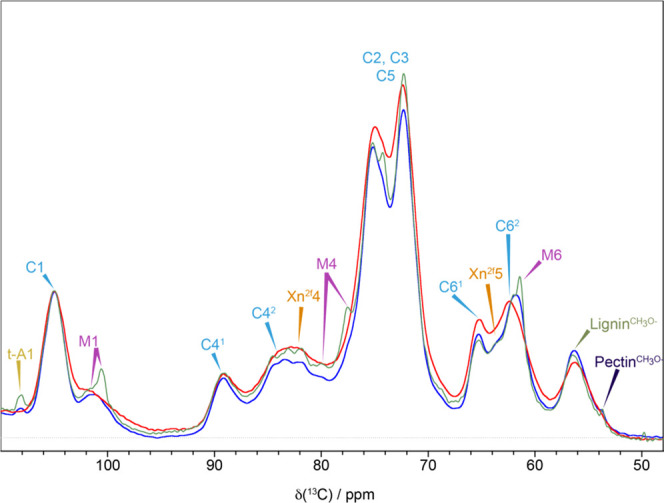
Figure 2.

Differences in the quantitative 1D 13C NMR spectrum of pine in 3 different hydration states. A comparison of the polysaccharide region of the quantitative 1D 13C DP-MAS NMR spectra of never-dried pine (blue), oven-dried pine (red), and rehydrated pine (green). Spectra have been normalized to the same total integrated intensity and were recorded at a 13C Larmor frequency of 150.7 MHz and a MAS frequency of 12 kHz.
