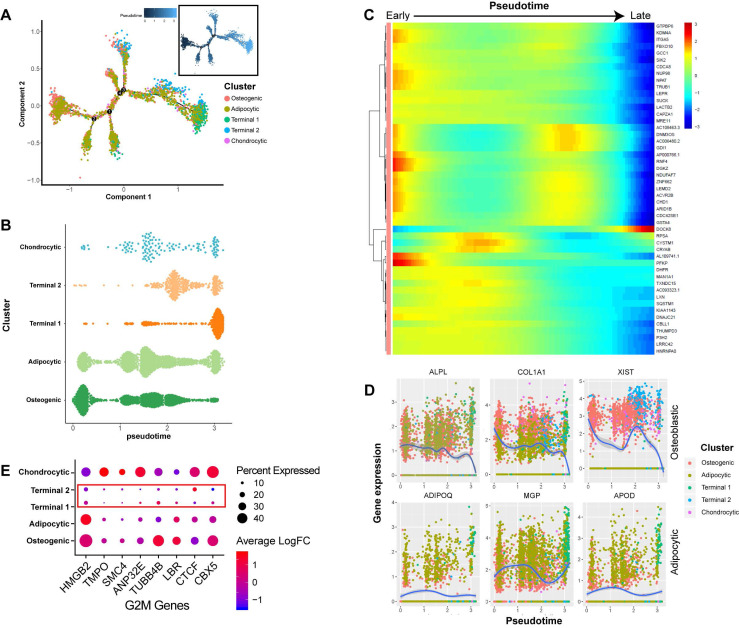
Figure 2.
Dynamic gene expression patterns of human BM-MSCs. (A) Reconstructed principal component graph of cell differentiation trajectory of BM-MSCs, colored by subpopulation identities. The upper-right trajectory plot in the square indicates the direction of pseudotime. (B) Distribution of each cell subpopulation along the pseudotime. (C) Continuum of dynamic gene expression in pseudotime of BM-MSCs. Heatmap shows top 50 genes with most significant expression changes. Pixel color indicates the expression level (logFC). (D) Expression level of osteogenic (top) and adipogenic (bottom) genes with respect to pseudotime coordinates. Blue lines depict the LOESS regression fit of the normalized expression values. (E) Expression pattern of G2M genes of BM-MSCs.

